
In business and leadership, Simon Sinek stands out as a beacon of inspiration, challenging conventional thinking with his groundbreaking concept: “Start with Why.” This principle, outlined in his renowned book and TED Talk, emphasizes the importance of identifying and harnessing our actions’ underlying purpose or motivation. While Sinek’s philosophy has primarily been applied to organizational leadership and personal development, its principles are relevant in trading and investing.

At the core of Sinek’s philosophy lies the belief that successful individuals and organizations are driven not solely by what they do or how they do it but by a clear understanding of why. This principle transcends industries, resonating deeply with traders and investors seeking to navigate the complexities of financial markets. By embracing the “Start with Why” mindset, traders can unlock a new dimension of purposeful trading, informed by a deep understanding of their objectives and motivations.
Enter NeverLossTrading, a leading provider of trading education and software solutions designed to empower traders with the tools and knowledge needed to succeed in today’s dynamic markets. Much like Sinek’s emphasis on purpose-driven leadership, NeverLossTrading encourages traders to approach the markets with clarity of purpose and a strategic mindset.
At the heart of NeverLossTrading’s approach lies a commitment to helping traders uncover their “why” – their underlying motivations, goals, and aspirations in the trading world. By starting with why, traders can cultivate a more profound sense of purpose and direction in their trading journey, guiding their decision-making process and fueling their long-term success.
NeverLossTrading offers comprehensive resources and tools to empower traders to trade confidently and consistently. From cutting-edge trading software to personalized coaching and mentorship programs, NeverLossTrading equips traders with the knowledge, skills, and support needed to thrive in today’s competitive markets.
One of the critical tenets of NeverLossTrading’s philosophy is the importance of strategy and planning in trading. By developing a clear trading plan rooted in their unique objectives and risk tolerance, traders can navigate market volatility with confidence and precision. Through ongoing education and mentorship, NeverLossTrading helps traders refine their strategies, adapt to changing market conditions, and stay ahead of the curve.
Incorporating the “Start with Why” principles into their trading approach, NeverLossTrading empowers traders to align their actions with their underlying motivations and goals. By understanding the “why” behind their trades, traders can make more informed decisions, mitigate risk, and maximize their potential for success.
In conclusion, Simon Sinek’s “Start with Why” philosophy offers invaluable insights for traders seeking to thrive in today’s dynamic markets. By embracing purposeful trading and aligning their actions with their underlying motivations, traders can chart a path to success guided by clarity, intention, and resilience. With NeverLossTrading as a trusted partner and guide, traders can confidently embark on their trading journey, equipped with the tools and knowledge needed to achieve their goals and realize their dreams.
In our training and coaching, we not only develop the reasons why with our clients, we help our clients formulate a written business plan for trading success, defining the reason to accept a trade, where we jointly decide the focus assets, the potential number of trades, risk tolerance, and return expectations—a plan for trading success with a spelled-out action plan (why and when to trade) and financial plan (number of trades and return expectation).
Learn how the chart will tell when to buy or sell, and we share the following examples.
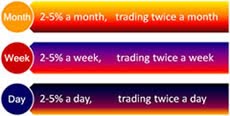
- Longer-term trading: weekly chart based.
- Swing trading: daily chart-based.
- Day trading: NLT Timeless Concept.
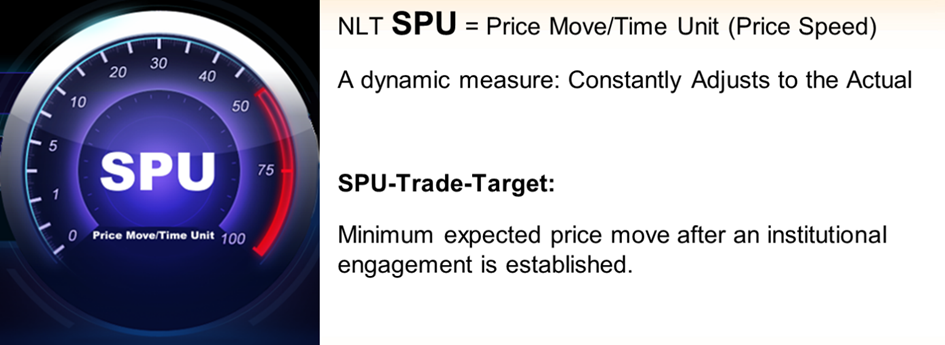
NLT trading decisions are indicator-based, where the system defines a price threshold: buy > or sell<, and we enter into a trade when this threshold is confirmed in the price movement of the next candle. In addition, at entry, the system defines the exit (dot on the chart).
Longer-Term Trading Examples
When accepting NLT Signals from weekly charts, the expected time to hold an open position is one to ten weeks, with a statistical peak of three weeks.
Individual stocks show more decisive and more predictable price moves than ETFs. To demonstrate the strength of our systems, we pick QQQ as our ETF example.
QQQ, NLT Weekly Chart

The QQQ chart shows seven confirmed trade situations, and we list the time to target-1, where we will take our exit.
Situation-1(7/31/23): two weeks to close at target.
Situation-2 (9/18/23): five weeks to close at target.
Situation-3 (10/30/23): three weeks to close at target.
Situation-4 (11/20/23): three weeks to target.
Situation-5 (1/8/24): one week (the prior sell signal was not confirmed)
Situation-6 (1/29/24): three weeks to target.
Situation-7/8 (3/4 and 4/8/24): not confirmed.
Swing Trading Example
Here, we decide from daily charts with an expected holding time for open positions between one and ten trading days and a culmination point at three days.
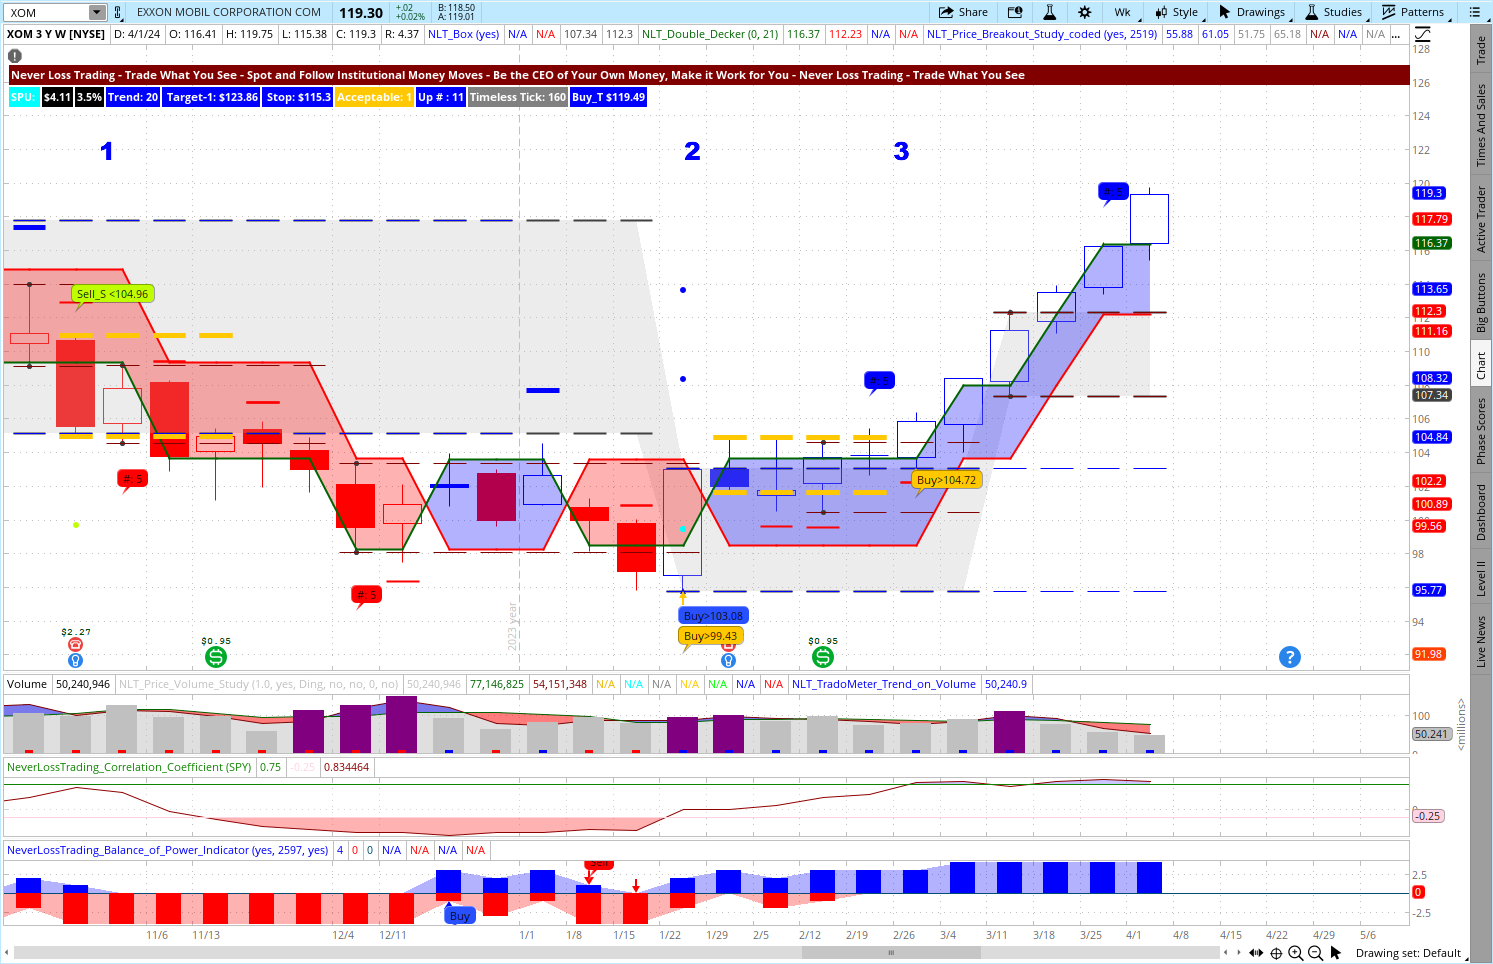
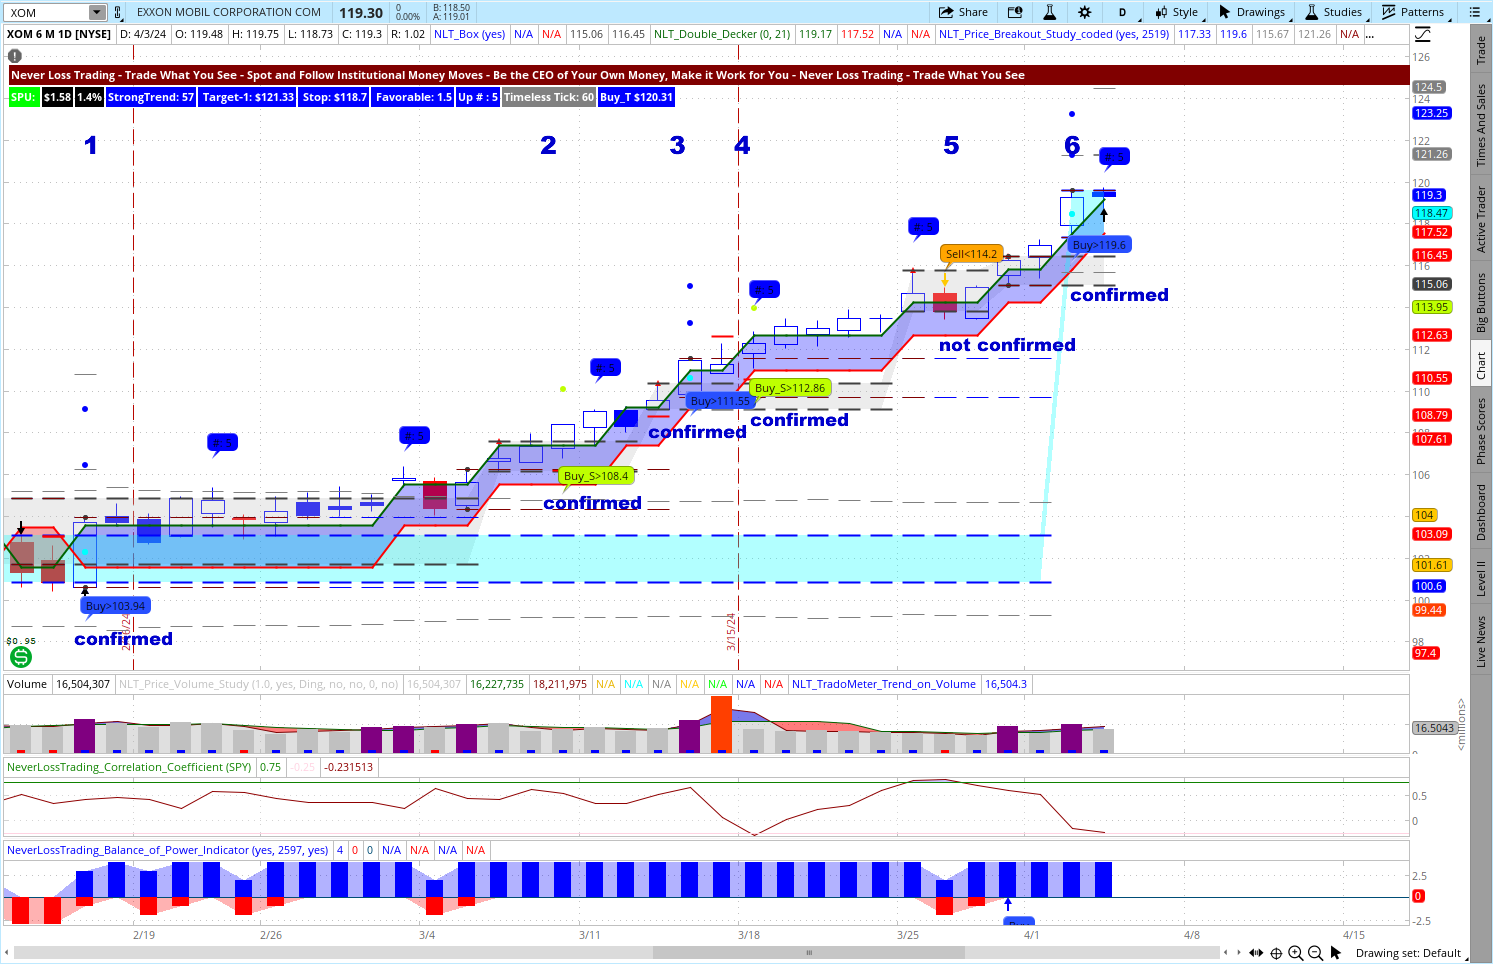
To demonstrate the strength of our system, we pick two widely held stocks to continue our analysis, XOM and LOW, and systematically adhere to confirmed price movement signals triggered when the price threshold is surpassed within the subsequent candle’s price action.
The XOM chart reveals six trading opportunities: four confirmed signals successfully reaching their predefined targets, not confirmed signals. Trade #6 also reached its system-set target in a matter of three trading days.
XOM, NLT Daily Combined System Chart

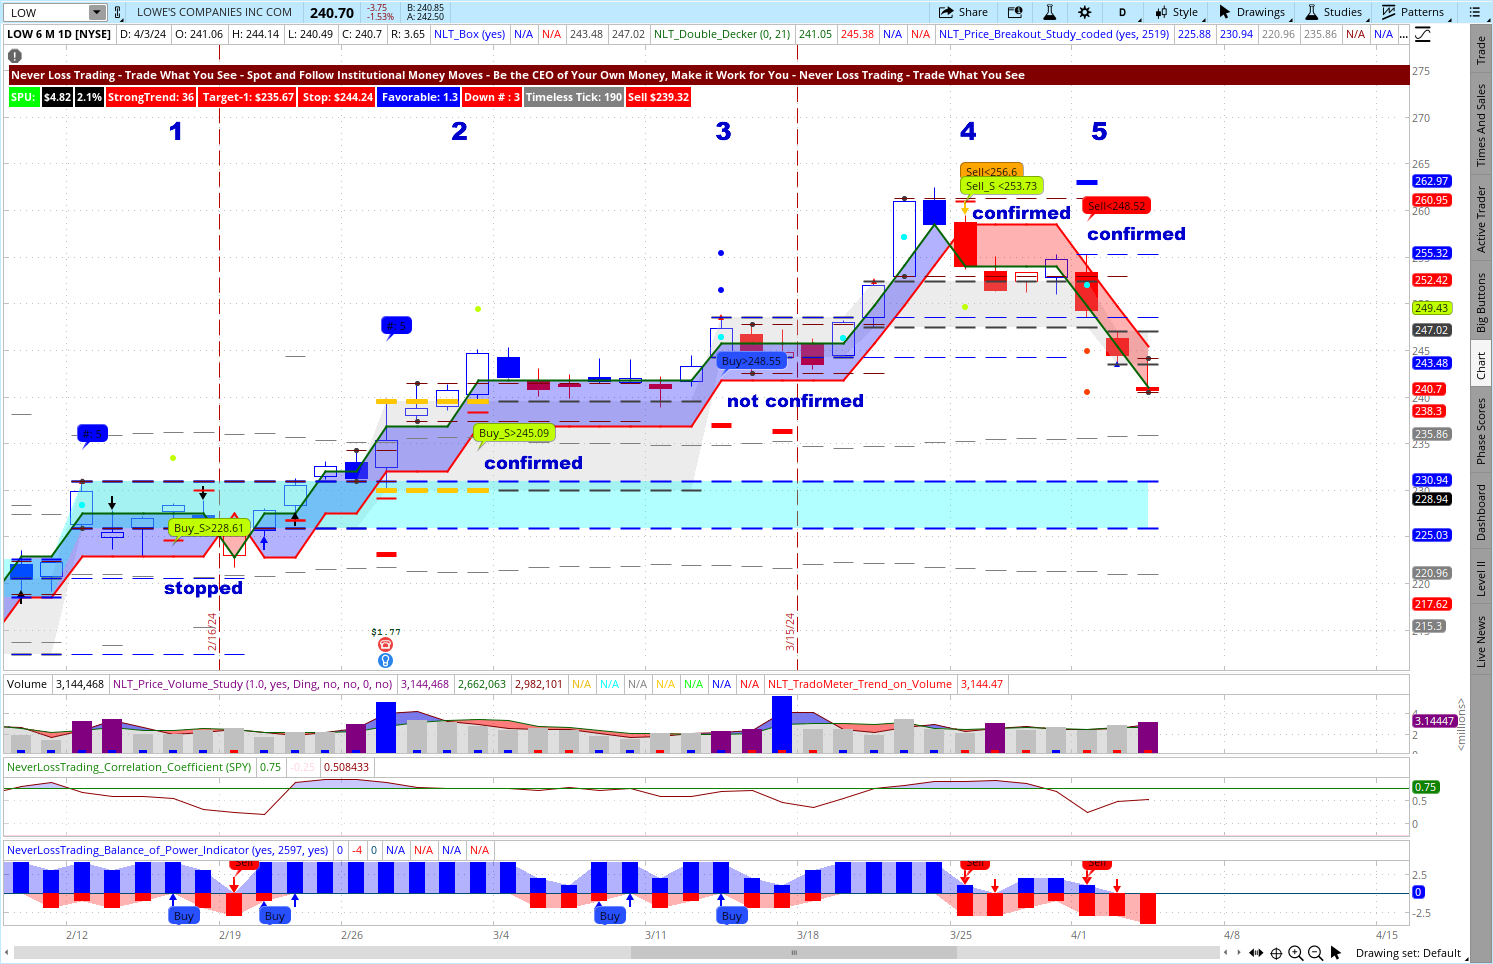
LOW, NLT Daily Combined System Chart

The daily LOW chart showed five trade indications, four of which were confirmed, three came to target, and one got stopped, indicating the highly probable price move forecast of the included NeverLossTrading signals.
Day Trading Example
The NLT Timeless concept enables traders to diversify their strategies and capture broader market movements by identifying trading opportunities across various price frames and asset classes, allowing decisions at multiple price increment levels.
NLT day trading decisions are based on a couple of rules, and we best start when not to accept a signal:
- In an NLT Purple Zone, because of the ambiguity of price direction.
- When an NLT Box Line cuts the way to target short, indicating supply or demand levels.
- There is no entry at the exit level of the prior signal.
We enter a trade when the spelled-out buy> or sell < price threshold is ticked out in the price development of the next candle. If this does not happen in the price move of the next candle, we will delete our order.
The trade target is highlighted by a dot on the chart and specified by the system.
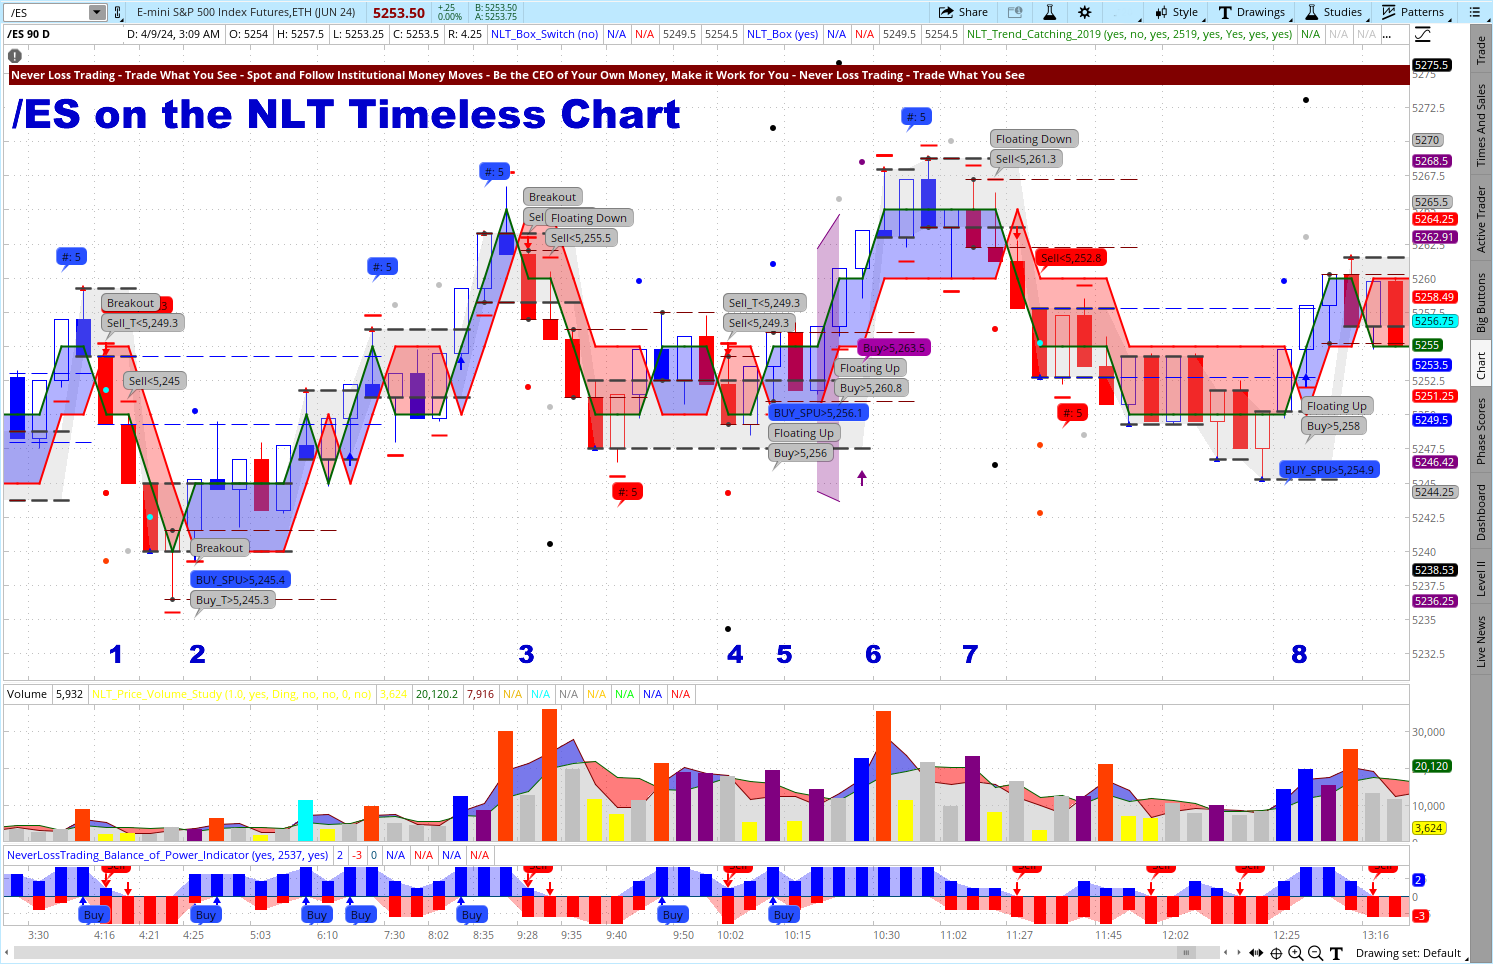
We now take a recent example for the E-Mini S&P 500 Futures Contract on April 8, 2024, between 3 a.m. and 1:30 p.m. EST, highlighting and discussing eight trade situations.
E-Mini S&P 500 Futures Contract April 8, 2024

Situation-1: A confirmed short signal came to target two after two candles, and we do not consider the second signal on the way down (down moves are framed in red, up in blue).
Situation-2: A confirmed long signal needed five candles to reach the system set target.
Situation-3: A confirmed short signal came to the target.
Situation-4: A dashed NLT Box Line cuts the way to target short, and we do not accept the trade.
Situation-5: A confirmed long signal came to the target. All signals have their tops at the red dashed line, which was not infringed on the way to the target.
Situation-6: No trades in the NLT Purple zone and no trades at exit levels.
Situation-7: A confirmed short signal that reached its target.
Situation-8: A confirmed long signal came to the target, and we did not consider the next signal after the trade initiation candle.
We do not always claim to have all winning trades, but we offer high probability setups above 68% by combining NLT Systems.
Conclusion
Whether your preferred trading style is, regardless if you are a novice trader or an experienced pro, NeverLossTrading has the solutions you need to navigate today’s markets confidently. With our comprehensive range of trading tools and education, you’ll be well-equipped to master the art of trading, striving to achieve consistent profits.
When you are ready to trade and invest in high-probability setups, ask us for our system bundle, and we work with you in a live session to find out what suits you best.
contact@NeverLossTrading.com Subj.: Demo
All our teaching and coaching is one-on-one; hence, spots are limited, and you do not want to miss out.
To receive our free trading tips, subscribe here.
We are looking forward to hearing back from you,
Thomas
Disclaimer, Terms and Conditions, Privacy | Customer Support


