Spot and Trade Institutional Money Moves

Algorithmic Trading with Human Interaction for:

Day Traders, Swing Traders, Long-Term Investors

Tuesday, September 27, 2016

Who is the better President for the Stock Market?

Tickety, tickety, tock, time is clicking off the clock and America is going to vote for the next President. Based on the poll numbers, this is going to be a close race.
In the spirit of this election cycle, we thought it would be a good time to clear up a question that comes up at every presidential election:
Who is better for the stock market?

Watch this publication as a video presentation...click
Chart-1: Stock Market Development based on NLT-Top-Line 2007 - 2016
Video Presentation
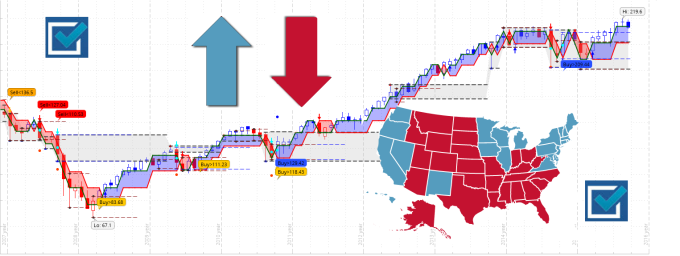
Our answer is and always will be: It does not matter!
When you are a prepared trader or investor:
  • You are following a system of pre-indicators, telling you when a price move is likely to happen: blue frames up, red frames down.
  • You operate with strategies that produce income if the markets go up or down.
  • You can combine longer-term and shorter-term trading strategies.
If this is not the case for you, read on and consider how being trained and prepared can make a difference for you.
Trade What You See: Let the chat tell, when to buy or sell!
Operate with:
Clearly defined entries, exits, and stop or trade adjustment levels.
Follow the pattern of the natural transaction cycle:
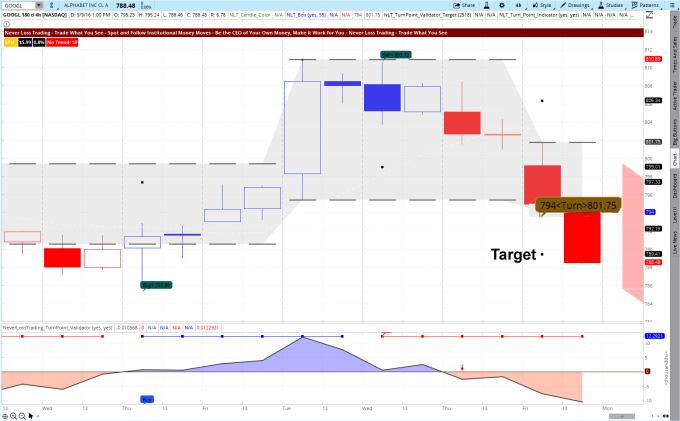
Chart-2: AAPL Daily Chart, June 22 – August 16, 2016
aapl-june-22-to-august-12-2016-rebalancing-2
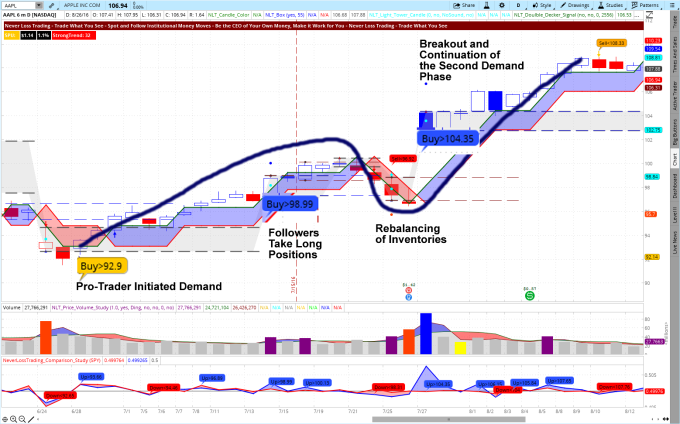
Institutional investments dominate 95% of all financial market transactions for stocks, options, futures, currencies.
By the sheer size and the interaction pattern of institutional leaders, gate keepers, and followers; our algorithms paint early price move potentials on your chart, so you can spot and follow institutional money moves:
  • Entering when they happen.
  • Exiting before they end.
Let us get you some examples and if you feel those can make a difference for your trading, ask us for a live demonstration, where you call the symbols and times and we jointly count good and bad trades:
Call: +1 866 455 4520 or contact@NeverLossTrading.com
By measuring and orienting at the underlying structure of the financial markets, our indicators are able to produce high probability directional chart setups for you that work on all time frames and for all asset classes: stocks, options, futures, currencies.
Our first example is a swing trading example:
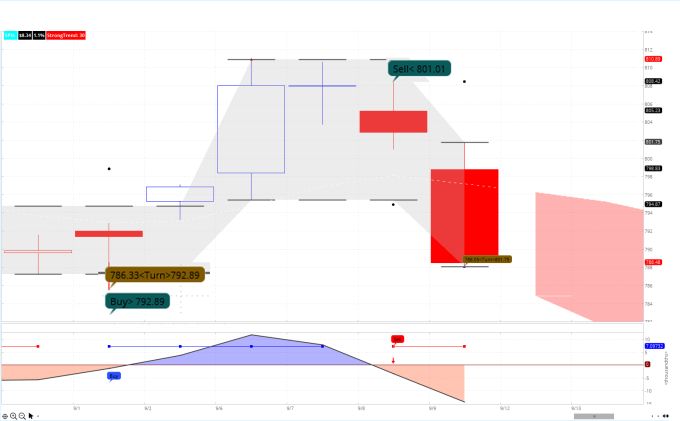
Chart-3: BIDU Daily Chart, August 2 – September 16, 2016
bidu-top-line-september-2016
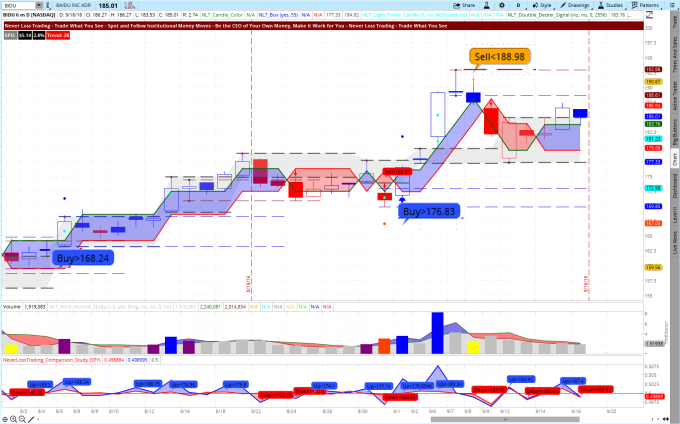
Following our system, you trade when a specific spelled out price threshold is surpassed in the next candle: Buy > 168.24 e.g. This way, you can operate with Buy-Stop or Sell-Stop orders and pre-program your trade entry without the need for being in front of your screen.
In our mentorship program, you also learn how to participate in those trades with simple option strategies, requiring you only a fraction of the share cost: 1-3%, and letting you participate in price moves to the up- or downside with a limited risk and a potential leverage.
To support your trading in and out of the election cycle, ask us for our election special on:
  • NLT Top-Line Light.
  • NLT Wealth Building and Income Generating.
By teaching one-on-one, we will work with you at your best available times and focus on your specific wants and needs as a trader or investor.
Every training session will be recorded, allowing you to go through the learned on any of your mobile devices.
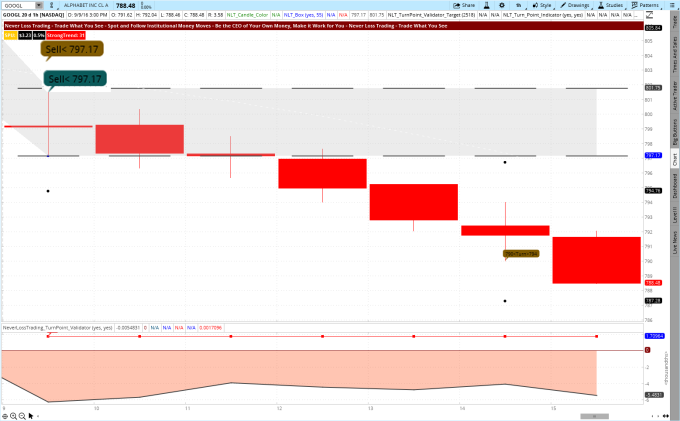
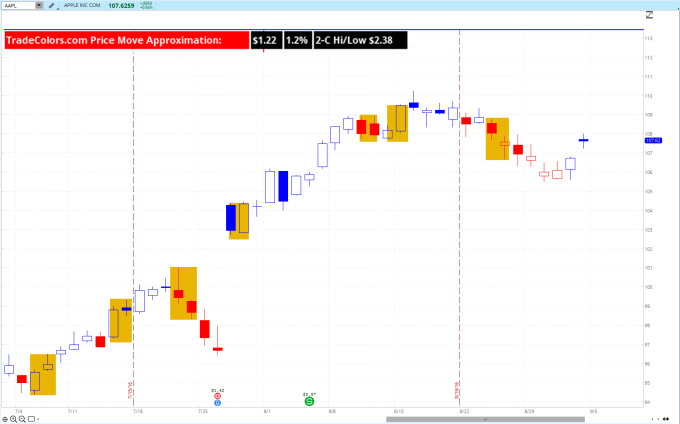
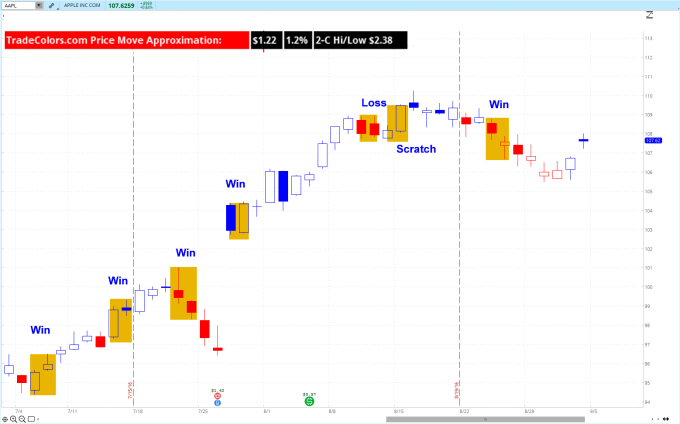
Chart-4: S&P E-Mini Futures Hourly Chart, September 12 – September 15, 2016
top-line-es-september-12-to-15-2016
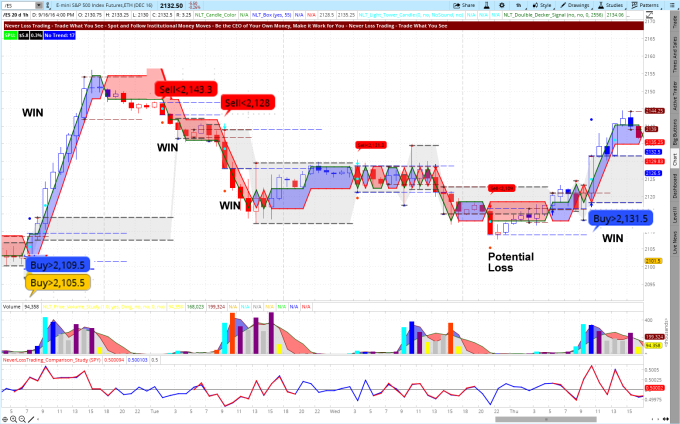
Chart-4 shows you five potential trade situations, highlighted by the system. When you traded them mechanically, you achieved four winners and one loser: 80%-success rate; however, you will also learn that some trade situations spelled out on the low are not a good place to trade at.  
Your trade rules are simple:
  • Trade, when the next candle surpasses the spelled out price threshold.
  • On red and blue signals, trade to the target dot or for five same-color-candles.
  • On orange signals, trade either to the next horizontal line or for a maximum of 10-bars.
  • If you like to trail your stop, trail with the red line of the box that is framing the price move: Expect a change in price momentum, when the red line is reached.
There is sure more to learn and we teach you in one-on-one sessions, focusing on your wants and needs as a day trader, swing trader, long-term investor or in applying a combination of multiple time-based strategies; helping you to build a business plan for your trading success: financial plan and action plan. Setup a live demonstration:
Call: +1 866 455 4520 or contact@NeverLossTrading.com

Monday, September 12, 2016

Are You an Average Trader or Investor?

Institutional investments dominate more than 95% of all financial market transactions.
Trading or investing is a professional business and professionals are prepared.
By entering the financial markets, you’re acting against some of the smartest, brightest, most aggressive people in the world. They’re playing to win every single day. For them, every day is the Super Cup Final.
If you are average and are trying to get by on a shoeshine and a smile, then the world is going to run you over. You need a system that gives you repetitive signals you can trust and you must prepare and prepare every day.
How to do so?
We provide our subscribers with a watch list of assets that have system specific setups.
For Friday, September 9, 2016 GOOGL e.g. was on a watch list, giving us a daily signal:
Chart-1: GOOGL on the Daily NLT TurnPoint Chart, August 31 – September 9, 2016
turn-point-googl-september-9-2016
By our system, we only trade when a signal is confirmed by price move of the next candle surpassing the spelled out price threshold: Sell < 801.01 was indeed surpassed by Fridays candle and led us to open a short position.
We had a similar situation on the chart on September 1: Buy>792.89 and the price direction was followed by the next candle and forward.
However, how would that work if you are a shorter-term trader?
Let us scale down to a 4-Hour Chart
Chart-2: GOOGL on the 4-Hour NLT TurnPoint Chart, August 31 – September 9, 2016
turn-point-googl-september-9-2016-4-hours
The chart shows a two-sided signal and the price threshold of Sell<794 a="" and="" at="" by="" candle="" chart.="" day="" development="" dot="" exit="" highlighted="" in="" led="" next="" o:p="" of="" on="" price="" profitable="" same="" surpassed="" target="" the="" to="" was="" which="">
However, if you are a shorter term trader, how would the system give you direction and the opportunity to act?
Let us go to a 1-hour chart and see if we got an entry that let us participate in the price direction of GOOGL that day:
Again, you will see, how two signals spelled out a price threshold: Sell <797 .17="" and="" candle="" direction.="" follow="" go="" in="" led="" next="" o:p="" price="" short="" surpassed="" the="" to="" was="" which="">
If you are trading from an IRA or account type that does not allow you to go short in stocks, we teach you, how you can participate in any direction by using options.

Options is one of our centers of expertise, and learning how to operate at multiple situations with simple options strategies is an essential skill every trader or investor shall have. 

Chart-2: GOOGL on the 1-Hour NLT TurnPoint Chart, September 9, 2016
Turrn Point GOOGL September 9, 2016 1 Hour.png
If you are not aiming to be an average investor, then you were prepared by knowing that GOOGL and others are on the list, showing a short signal indicated by institutional sell programs. Here our list for Friday, September 9, 2016:
Chart-3: NLT TurnPoint Alert for September 9, 2016 (sent September 8, 2016 to subscribers)
september-9-2016-buy-sell-programs-watch-list
You see: Never Loss Traders are prepared and act on what the chart is indicating.
If you like to be part of this: Call +1 866 455 4520 or contact@NeverLossTrading.com
Discover the power of working one-on-one with you, training and coaching you based on your wants and needs.

Saturday, September 3, 2016

Trading by Understanding Leaders, Followers, and Gatekeepers

When leaders lead and followers jump on what they identify the leaders intend to do, then gate keepers will control the door with a constant aim to better their own situation.
Does that sound familiar?
The financial markets work that way:
Prop-Traders lead the pack with their analysis of what assets to be long or short in.
The action of the Prop-Traders creates a first indication of a change in supply and demand, our indicators measure and when early followers enter in the spotted direction, we trade.
From the beginning, we know that Gatekeepers will aim to change the situation in their favor by trading against the predominate direction and this rebalances their inventories.
Let us look how this is expressed on a chart:
We choose a TradeColors.com chart and highlight inventory rebalancing points, where prices go the opposite way for a little before they go up or down:
Chart-1: AAPL Daily TradeColors.com Chart
Rebalancing AAPL TradeColors
Let us now highlight in an orange square trade setup that leads to a trade entry by following the rules of our system: A setup is built by two-new-same-color candles in a sequence; however, we only accept a trade if the high of the second-blue-candle or the low of the second-red-candle is surpassed by the following candle.
We trade for a maximum of five candles of the same color sequence or take our exit at the approximated price distance of the setup, which is announced on the left corner of our chart.
In addition, we do not hold over earnings.
Simple rules and here is the setup how it worked on the chart:
Chart-2: AAPL Daily TradeColors.com Chart with Trade Setups
Rebalancing AAPL TradeColors Setups
When we followed those rules and mechanically traded from the chart, this would be the outcome:
  • Winning trades: 5 or 71%
  • Losing trades: 1 or 14.5%
  • Scratch trades: 1 or 14.5%
If you are not trading at such attainment level, feel invited to join the circle of NeverLossTrading, while we need to comply to SEC regulations and share with you, that past performance cannot always be taken indicative for future results.
TradeColors.com is our entry level program, and if you decide to start here, you can always upgrade to a higher level system; getting your paid tuition acknowledged at the upgrade.
Here is an overview of the different systems and mentorships, we offer…click.
If you see a fit for what you want to achieve in your trading, please do not hesitate for a live, free of charge demonstration.
Call: +1 866 455 45520 or contact@NeverLossTrading.com
Take a look at the evaluation of the individual trades, highlighted by the system:
Chart-2: AAPL Daily TradeColors.com Chart with Trade Setups
Rebalancing AAPL TradeColors Setups 2
TradeColors.com is just the beginning. We only teach one-on-one; hence capacities are limited, so do not miss out:
Call: +1 866 455 45520 or contact@NeverLossTrading.com
If you are not already part of our free trading tips, webinars and alerts…sign up here.
We are looking forward to hearing back from you,
Thomas