
Embark on a dual educational journey with us today:
Trade Earnings Price Moves
Engage in directional trades during and after the imminent earnings season with our latest innovative tool: “The NLT Earnings Price Movers Concept.” Delve into the concept details below.
Complimentary Trading and Investing Magazine
Additionally, access a trove of invaluable insights from various viewpoints with the complimentary trading and investing magazine. Stay abreast of the dynamic financial markets landscape through Traders World Magazine #92.
Our feature article, “Maximizing Trading Results by Acting at Crucial Price Turning Points,” is prominently featured on page 30. Download the magazine for free.

Don’t miss out on this enriching experience that arms you with tools and perspectives to navigate the complexities of trading and investing.
Trade Earnings Price Moves
The NeverLossTrading Earnings Price Move Indicator is revolutionizing how traders identify and capitalize on price movements associated with quarterly earnings reports. This powerful tool gives traders a strategic advantage in navigating the dynamic world of financial markets.
On April 12, 2024, the inauguration of JPMorgan Chase Manhattan’s first quarter 2024 earnings reports marks the commencement of the new earnings season. With our latest tool, you can seize lucrative opportunities for weeks by initiating strategic directional trades.
At its core, the NLT Earnings Price Move Indicator highlights critical price turning points of specifically defined stocks associated with significant price moves after quarterly earnings declarations.
One of the critical features of the NLT Earnings Price Move Indicator is its ability to frame the price range of the candle associated with quarterly earnings, allowing traders to visualize the extent of the price movement triggered by earnings reports, providing invaluable insights into market dynamics.
When a stock experiences an NLT, buy or sell signal within the specified time frame or closes above or below the framed price range, it often signals a high-probability price move for one SPU.
SPU is our measure to define how far a price move shall reach:
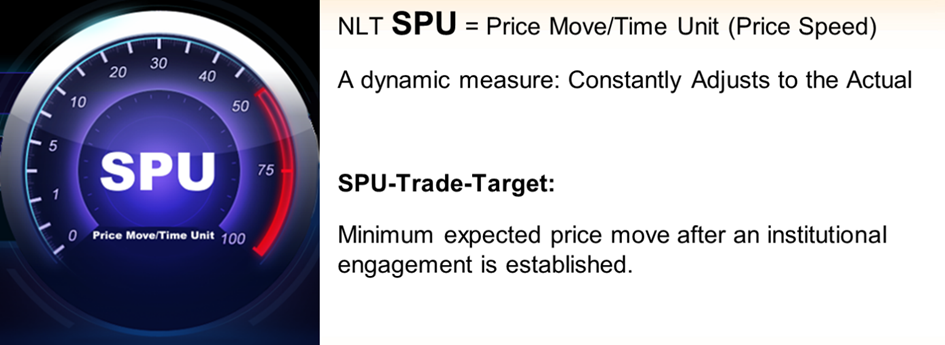
Traders can leverage this information to make informed trading decisions, such as entering or exiting positions or implementing hedging strategies to generate consistent profits.
We have developed the NLT Earnings Price Move Concept, a proprietary approach designed to capitalize on predictable price movements surrounding earnings announcements. However, not all stocks are created equal, and selecting suitable candidates for optimal results is crucial. The effectiveness of the NLT Earnings Price Move Concept hinges on carefully selecting stocks that meet specific criteria. To maximize the concept’s efficacy, we considered the following requirements:
NLT Earnings Stock Movers Requirements
- Average Daily Trading Volume: Stocks must exhibit an average daily trading volume above 2,000 shares to ensure adequate liquidity and price movement.
- Easy-to-Borrow (ETB) Status: We preferred stocks categorized as easy to borrow, allowing short trading potentials without obstacles.
- Solid Options Chain: An extensive options chain is essential to facilitate short-trading strategies when stocks become hard to borrow (HTB) or to provide protection in the event of an adverse initial price move.
From a comprehensive panel of approximately 300 stocks that meet the criteria above, we meticulously narrow our focus to a select dozen stocks that exhibit the highest predictability regarding earnings price moves. These focus stocks undergo rigorous analysis and scrutiny to ensure they align perfectly with our trading objectives and criteria and derive from different industry sectors.
NeverLossTrading is not a vow of infallibility in trading; instead, it embodies the art of seizing high-probability price turning points, aiming for consistent income by skillfully averting drawdowns.
NLT Focus Stocks with Earnings Price Moves

Our focus stocks represent a curated selection of equities with consistent and reliable earnings price move patterns. Concentrating on these stocks, we aim to capitalize on weekly price move patterns precisely and confidently. On average, these focus stocks offer a price move potential of 5% return on cash, as measured by the NLT SPU Measure.
In this publication, we only disclose examples of one of our stock candidates, AAPL, and its earning price move patterns.
Chart Examples
Crucial for acting at earnings price moves are the following:
- Confirmed directional price move indications by NLT signals in or outside the NLT Earnings Price Zone.
- Candle close outside the specified earnings prize zone or carries an NLT signal.
Trade indications come from whatever comes first, while we avoid signals that gap more than 1/2-SPU in any direction and do not open new trades in NLT Purple Zones.
AAPL is susceptive to daily and weekly signals:
- We expect a price move of about 2% value change on daily signals.
- On weekly signals, we expect a price move of about 4%.
We take examples of earnings price moves over the last three years for daily and weekly opportunities and discuss the setups and how to act best.
AAPL, Earnings April 2021, Daily Chart

By printing an NLT Purple Zone over earnings and gapping up, no directional trade is acceptable, and we need to wait for the following qualified signal on the chart: Sell_S<125.17.
The daily chart on the earnings conference in July had again an NLT Purple Zone and no trading opportunity.
The following chart will show an exciting constellation:
- Short signal after earnings by the candle on 4/29/22 closing outside the NLT Earnigns Price Range.
- Confirmed buy signal on 5/3/22 that came to target and was followed by another buy signal, frightening the trade to come to a stop or price adjustment level.
- However, the stop price level was not reached, and the price move commenced to its target.
- The stop placement for the trade candle was at the low + 20% of one SPU.
AAPL, Earnings April 2022, Daily Chart

AAPL, Earnings February 2023, Daily Chart

The NLT PowerTower of February 2, 2023, was confirmed the next day, and the price move commenced to target. The chart shows another buy signal combination that was not confirmed.
AAPL Earnings, November 2023, Weekly Chart

In the chart above, you see a close above the critical price zone on day two after earnings, followed by an additional buy signal on 11/6/23, and the trade came to its system-defined target at the dot on the chart.
Next, we check on weekly price developments and setups, showing fewer gaps and with an even stronger predictability.
The first chart again shows the April 2021 earnings candle, and it is obvious how the next candle closes outside the earnings price range and leads to a 1-Weekly-SPU price move to the downside, which concluded the trade after two weeks at target.
Weekly happenings are easier to follow, and out of the twelve stocks we list as fitting for this trading concept, only two have allowed for entries at the daily level, and AAPL is one of them.
AAPL Earnings, February 2022, Weekly Chart

AAPL Earnings, July 2022, Weekly Chart

In July 2022, we saw a zone breakout with an NLT signal that came to its system-defined target (dot on the chart).
AAPL, January and May 2023, Weekly Chart

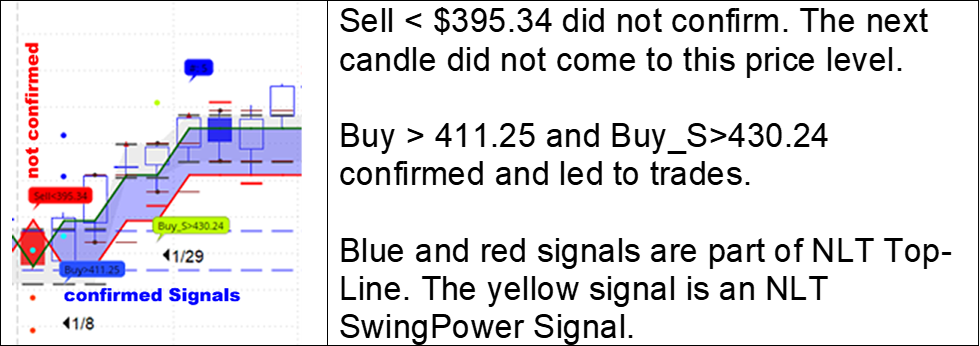
Hence, the new NLT Earnings Price Move Indication is best combined with other NLT Systems to act at crucial price turning points. The signals on the chart derive from:
- NLT Top-Line (red, blue, orange, and Purple Zone)
- NLT Swing Power (yellow)
- NLT Price Move Indicator (green)
The time from entry to target varied between one and six candles, translating to a holding time of one to six weeks to close the open position at target. Stops were not infringed in the trades shown.
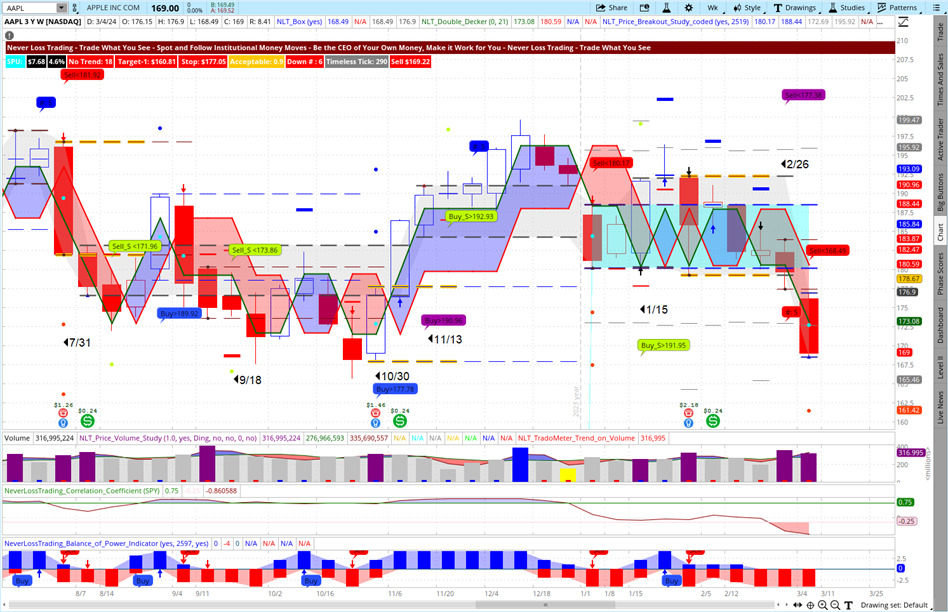
AAPL, Three Most Recent Earnings Calls, Weekly Chart

The chart presents a comprehensive integration of signal combinations with earnings data, offering valuable insights for strategic trading decisions:
- However, in the preceding two earnings calls, opportune signals allowed trading opportunities with a 1-SPU target, seamlessly navigating through the NLT Purple Zone, which only occurred after the second candle concluded.
- Additionally, supplementary signals further bolstered robust trades towards the designated targets.
- Regrettably, the signal Buy_S>191.95 was overlooked due to our policy of refraining from holding positions over earnings announcements.
These examples serve as a testament to the efficacy of our systems in identifying pivotal price turning points, both post-earnings conferences and throughout the year, independent of such events.
For new NLT Top-Line signups, we’re delighted to offer the NLT Earnings Price Move indicator as a complimentary addition. For existing NLT users, the NLT Earnings Price Move concept upgrade is available for $2,999, including three hours of personalized education, chart setup, and watchlist training. This training encompasses the indicator’s integration and provides invaluable insights into curating an optimized watch list and NLT Alert (free for two months) for additional trading opportunities.
We hope these examples help you understand how our systems point to crucial price turning points after earnings conferences and throughout the year, outside of those events.
Investors can streamline their trading activities by focusing on a limited number of stocks, affording greater convenience and multiplying potential opportunities. With an average of 48 trading opportunities per year across 12 carefully chosen stocks, supplemented by ancillary signals, the potential for profitability is manifold.
If you’re prepared to seize this opportunity, don’t hesitate to reach out to us:
contact@NeverLossTrading.com Subj.: Earnings
We’re eager to arrange an online consultation to tailor a system combination that aligns seamlessly with your unique trading style. We will also explain some rules we apply to our signals there.
Thomas Barmann (inventor and founder of NeverLossTrading)
Disclaimer, Terms and Conditions, Privacy | Customer Support


