Spot and Trade Institutional Money Moves

Algorithmic Trading with Human Interaction for:

Day Traders, Swing Traders, Long-Term Investors

Saturday, March 25, 2023

Competing with Timeless Day Trading

As a day trader, you compete with institutional-run computers that can process information faster and execute trades more efficiently than humans. However, there are still opportunities to act less predictably and capture actual price turning points. Successful day trading requires knowledge, skill, and discipline. Staying focused on your goals and avoiding being swayed by emotions or market fluctuations is essential. Competing and succeeding in day trading is possible with the right approach, system, and plan. Read on for the most recent examples.

"Timeless trading" refers to a strategy that considers consistent price increments as the decision-making basis instead of price movement over time. This way, time is no more a critical variable for forming trading or investing decisions. Our systems define which assets provide a solid basis for price moves, and we follow them with the NLT Timeless Concept.

NLT Timeless charts use system-defined price increments to determine crucial price turning points to act upon. For example, on the chart, candles are drawn purely price based: when the price movement exceeds the specified increment, a new candle is added. With the help of indicators, traders can make high-probability decisions, where the system spells out the price threshold for entering a trade, exiting and stopping, keeping risk and reward always in a meaningful balance.

A prerequisite for day traders: you must withstand the temptation to trade frequently instead of more accurately. You can increase your trading accuracy using dynamic, less predictable entries, exits, and stops. As a trader, you are a probability thinker, which means there is no 100% certainty that your decision will lead to a positive outcome. More frightening: 76% of day traders are losing money. Trading is not a game where the smartest are necessarily the best. If IQ were a ticket to riches in the market, many more successful traders would be there. From our experience, you need to put the odds in your favor by operating with a system and rules of 65% or higher predictability; else, the chance for success will be random.

The worst trader has positive trades, but it is not about those but your average winning balance. Only when this is positive are you trading with an expectation of producing a return from your financial market investments.

What is the basis of your decision-making, and do you want to better your trading or justify that you were right because you had random wins?

Make a change to your trading:

  • Decide on high-probability price turning points
  • Be less predictable in your actions
  • Follow a plan for trading success and strive for a budget

Read on to see how our charts tell when to buy or sell! This article is put together on the weekend of March 19, 2023, and we pick day trading examples of and into the last trading day: March 17, 2023. In our chart appraisal, we will accept each signal as it appears while we teach how to select higher over lower probability setups in our training and coaching sessions.

Trading is not an easy career: when you add up what it costs to not act at high probability price-turning points, you might be open to investing in a high-probability system and appropriate education.

We highly propose following a business plan for trading success that shall entail:

  • Acting with a system probability > 65%
  • Mechanical rules for entry, exit, and stop
  • Trade at perfect moments only
  • Consider overall factors, patterns
  • Risk and reward in an acceptable balance
  • Risk-averse trading
  • Holding positions to target
  • Do not add to losers
  • Stick with a trading strategy. Follow a business plan – action plan and financial plan
  • Trade for meaningful price moves
  • Systematic trading
  • Having a mentor to learn from

You can increase your trading accuracy using dynamic, less predictable entries, exits, and stops.

The typical problem for a trader: In hindsight, you know what happened, and we want to help you forecast the future price happening with high predictability.

Money flow accepts price as the resulting variable of a change in supply and demand and specifies potential price move setups with clearly defined:

  • Entries (price threshold)
  • Exits (targets)
  • Stops (wrong assumption)
  • All dimensions are prepared and defined when the entry conditions are fulfilled

With our systems and strategies, we want to help you to higher accuracy:

  • Only accepting a trade when the direction is confirmed
  • Exiting at a pre-defined target, preventing the price from pulling back, and taking your profits away before you realize them
  • Choosing an adequate stop; so you are not taken out of a trade by a too-tight stop and keeping reward and risk in a meaningful balance.

A Quick tip: buyers and sellers move the market; whoever has the upper hand moves the market in their direction.

With our indications, we simplify life for you as a trader and let the  chart tell when to buy or sell, specifying all decision-making dimensions at once:

  • Entry Conditions: Execute buy-stop or sell-stop orders at pre-defined price thresholds at an assumed high probability
  • Exit Condition: When is the target reached
  • Stop Condition: When are you wrong and exit
  • Risk Management: Risk limiting  and risk-adjusted by considering the Relation of (Entry-Exit) / (Entry – Stop)

When day trading for pre-defined price moves, positions are kept open for a couple of bars/candles but permanently close the same day.

Our systems define the price increment to choose for setting up the charts, specifying two ranges:

  • Shorter-term: holding open positions between two and 20 minutes
  • Longer-term: holding open positions for 20 minutes to hours

We share examples for the E-Mini S&P 500 futures contract and Crude Oil futures, our most favored assets for day trading.

E-Mini S&P 500 Contract, March 14 -17, 2023

Chart Analysis: Four trade situations to discuss with the following conditions:

Situation-1: Sell < $3,890.80 was indicated at 6:40 a.m. ET and came to target at 9:30 a.m. ET. The gray dot on the chart is the trade target the red crossbar is the stop.  

Situation-2: The combination of Buy>3,814.80 and Floating indicated a strong upside price move potential. The trade opened at 2:20 p.m. ET and reached the target at 3:50 p.m. ET.

Situation-3:  We will teach in our mentorship why you would not have accepted the short signal; however, we appraise indications mechanically here, and then this trade got stopped.

Situation-4: Buy > $3943 was confirmed around 10:50 a.m. ET and came to target around 11:30 a.m. ET.

In total: three winning and one losing trade in the most recent development of the E-Mini S&P 500 Futures contract with the help of the NLT Timeless Chart. Let us check Gold:

Crude Oil Contract, March 14 - 17, 2023

The chart shows six potential trade situations. Please check which indications came to the system-defined target (gray dot) and which got stopped (red crossbar at the signal candle):

The choice is up to every trader; with the periods required for trades to enter and realize, you do not have to rush into trades.

If you like to act in a more fast pace environment, we offer you the NLT shorter-term day trading setups and add some examples.

E-Mini S&P 500 Contract, March 17, 2023
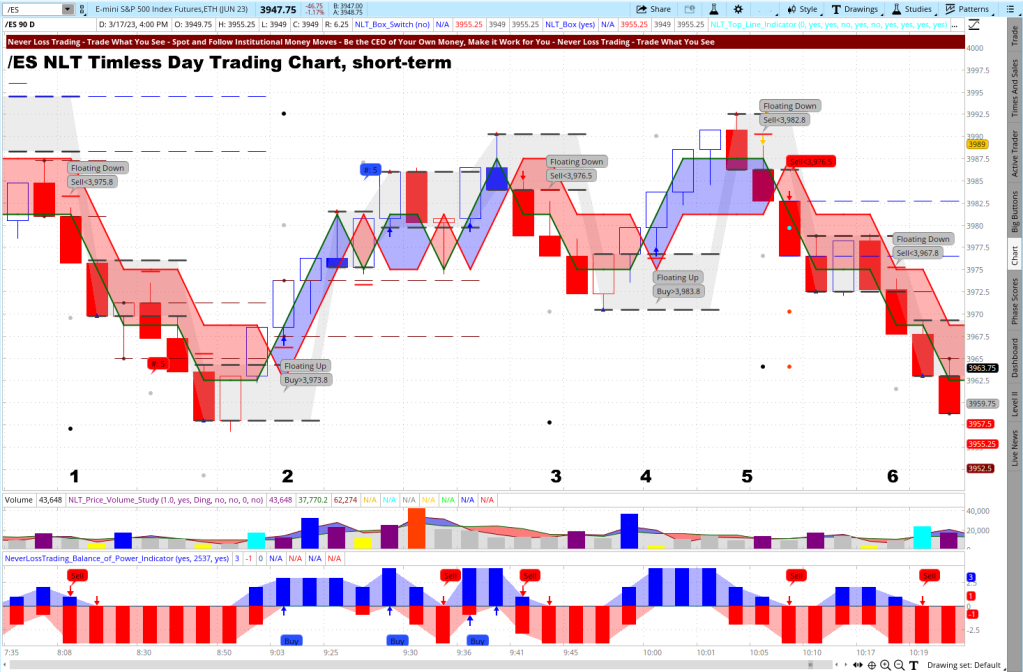
The chart shows six trade situations that reached their target between 7:30 a.m. ET and 10:30 a.m. ET. Understanding that we are acting under uncertainty and cannot always be 100% correct in forecasting price moves, we mostly close the books after two winning trades.

Our examples show multiple trading opportunities: imagine what this would do to your trading account if you landed those.

If you like to see how our systems work realtime:

contact@NeverLossTrading.com Subj.: Demo

Indeed, our systems work for other assets. For example, the following chart shows the Gold Futures contract price development with NLT Timeless Trading Indications on the afternoon of March 17, 2023.

Gold Futures Contract, March 17, 2023

The chart shows five trade situations. Appraising them mechanically: four reached their target, and one got stopped (situation-4).

To succeed in trading, you best work with an experienced coach and learn much about trading. Our #1 competitive advantage is the support and customer service we offer. We work one-on-one with you to specify what we teach to your specific wants and needs.

Ongoing education and mentoring are crucial to longevity in this business. Veteran traders have been through more ups and downs than you can imagine. So, experienced pros have probably experienced whatever you're going through.

We are happy to share our experiences and help you build your trading business. Trading is not a typical career, and you best learn from those who are long-term in this business to cope with the rollercoaster of the financial markets.

Here is another example of Crude Oil Futures:

Crude Oil Futures Contract, March 17, 2023

The chart shows five trade situations, and we let you appraise if they came to their system-set target (gray dot on the chart).

The markets changed, and if you do not change your trading strategies with them, it can be a very costly undertaking.

We are here to support you. Based on working one-on-one, spots are not always available.

Good trading,

Thomas Barmann (inventor and founder of NeverLossTrading)

www.NeverLossTrading.com

Disclaimer, Terms and Conditions, Privacy | Customer

Saturday, March 18, 2023

Probability Trader

As a trader or investor, you want to predict or forecast the future price happening of underlying assets like stocks, options, futures, and FOREX. We want to help you with modern algorithms, including AI components, to make sound and highly probable decisions in the financial markets.

Predicting and forecasting price movements are terms often used interchangeably but have distinct differences.

Predicting refers to making an educated guess or estimating the future based on existing data and trends. It can be a subjective process and may involve intuition or experience. Forecasting, on the other hand, is a more formal and quantitative process of predicting future trends and events. It uses statistical and mathematical models to analyze data and predict future outcomes. Forecasts often consider a range of possible scenarios and assess the likelihood of each one. They also typically incorporate uncertainty and risk analysis.

In summary, while predicting can be based on intuition or experience, forecasting involves a more formal and systematic approach that incorporates statistical and mathematical models and considers a range of possible outcomes. In our aim to keep discretionary decisions to a minimum, we rely on quantitative models to specify and forecast price moves by defining the following:

  • Entry Conditions: When will a price move be initiated, expressed by a buy or sell threshold, which starts the model and forecast?
  • Specifying the highly likely exit point for the trade accepted
  • Defining the likelihood of the setup to come to target by the strength of the signal setup at entry
  • Calculating the statistical volatility of the observed asset to define the stop, so a trade can be carried to the specified exit without getting stopped by the natural price movement of the underlying
  • Relating risk and reward with the probability of the setup at the entry to accept or pass on the trading opportunity

Probability thinking in trading considers the likelihood of different forecasts coming to target by the specified conditions we just spelled out. With the help of our systems and their components, traders can make informed decisions and actions. Probability thinking involves recognizing that uncertainty and randomness are inherent in many situations where one thing is for sure: 100% certainty is not achievable by any system or indicator.

If you want to start making money trading, do not make one bet after another, trying the bend the odds your way by widespread participation. The key to trading or investing success is to find situations where the odds are in your favor and act. When the price movement does not allow acting, stay out. When you learn and inhale that hard work gets the job done, we propose that less trading is more; it often provides a contradictive challenge our students learn to master. Think of it this way: If you are operating under a 50% likelihood of forecasting the future price happening, then you are acting like you are at a coin toss. Losing four times in a row has only a 6.5% likelihood; hence, you can celebrate some winners but not many to bring you to long-term profitability. If you like to read more details about less trading is more, write us an email, and we will send you a copy of our concept:

contact@NeverLossTrading.com Subj.: Less is More

High-probability trading refers to a strategy that seeks to identify trades with a higher likelihood of success than failure. We put that minimum requirement to a 65% likelihood. In reality, most retail traders operate by forecasting future price happenings with a 53% to 55% probability. When we compare a 55% and 65% system and calculate the chance of winning six or more trades out of ten: the 55% system gives us a likelihood of 50.4% (random), while the 65% system provides a 75.1% chance of winning six or more trades out of ten.

The key to successful high-probability trading is a disciplined approach and a sound understanding of the markets. In addition, traders must recognize and act on opportunities quickly while minimizing risk exposure.

Trading is not easy, but it is learnable: We teach all this and more in personal trading and coaching sessions at your best available days and hours.

Let us dive into some examples of forecasting the future price of different assets.

Weekly charts provide a solid basis for forecasting the price happening of assets longer-term. We extrapolate or forecast price moves for the next five to ten weeks based on our indicators; however, one of our indicators proposes not to engage in longer-term happenings. Let us explain why:

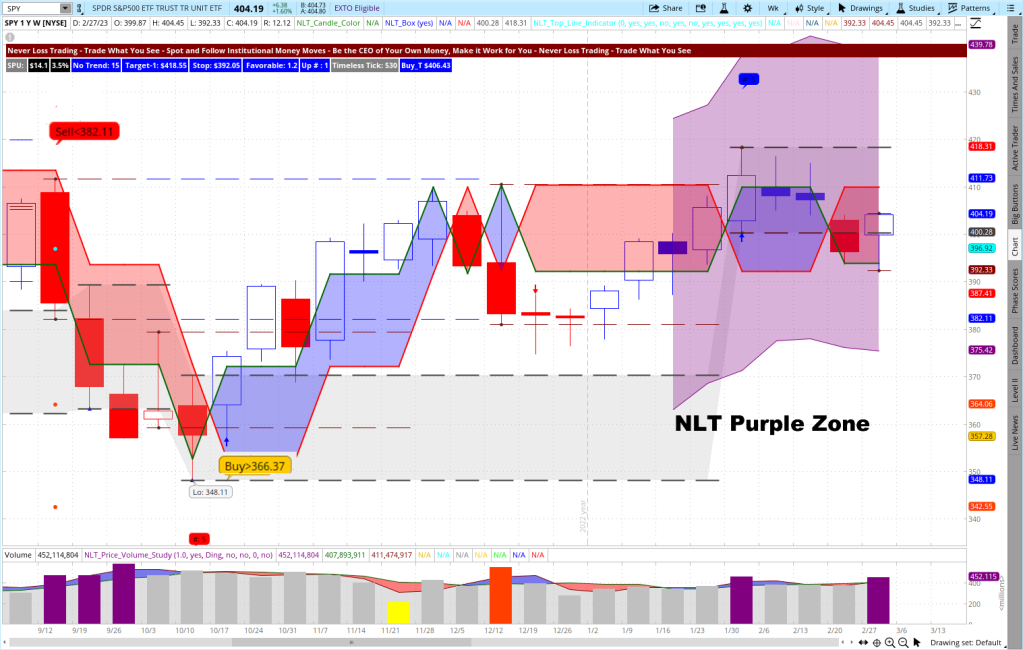
Our algorithm’s color upside price moves in blue and moves to the downside in red. However, when the market is undecided, and we have ambiguity in the price direction, an NLT Purple Zone is put on the chart, saying that engaging at this time frame is risky. We do the most naturally; we do not take trades from weekly indications but instead rely on lower time frames when there is no directional ambiguity.

SPY, S&P 500 Index, Weekly NLT Top-Line Chart

You see a weekly chart between 8/15/22 and 3/10/23. The first two sell signal were confirmed by the price movement of the next candle surpassing the sell threshold: Sell < $405.25 and sell < 382.11. Dots on the chart specify the targets for the trade. The buy signal from the week of 10/17/22 was confirmed and led to a trade to the following horizontal dashed line.

Since the week of 1/16/23, the price development of the S&P 500 has been in an NLT Purple Zone. However, since 85% of the stocks follow the index, it is not a good time for a longer-term buy&hold, and you best scale down your decision-making time frame. So why would you commit when the overall market does not?

However, there are still opportunities for swing or day traders to participate in shorter-term price movements. At the same time, you must operate with risk-limiting strategies that let you follow price moves to the up and downside. We teach those in our mentorships.

In the following chart, the NLT NLT Top and Bottom Finder paint crucial price turning points on the chart, and we analyze the happening in a two-step approach.

On 2/3/2023, we painted a longer-term happening on the chart and followed up the last indication based on March 10, 2023.

SPX, S&P 500 Index, NLT HF Price Turning Points

Imagine you were able to act on these crucial swing trading points, going long or short with risk-limiting and even leveraging strategies. What would that do to your trading?

The indicator combination you see is part of our NLT HF Trading Concept. In the next step, we check for the price development of the 2/3/23 signal, where the target of this indicator is at the next dashed crossline, and the price move indication was good for 235 SPX points. So if you traded, for example, the E-Mini S&P 500 futures contract, this would have given you an income of $11,750 per contract with a capital engagement of about $12,000 in about four weeks.

SPX, S&P 500 Index, NLT HF Price Turning Points

Hence, there are always opportunities, and when you trade what you see, you can follow strong price turning points with a high probability.

If you instead prefer day trading, we provide a model where the candles on the chart are created price based instead of time-based. With the help of the NLT Timeless Concept, we cut overall price moves into risk-manageable units which provide multiple opportunities:

  • Every setup is pre-approved on risk to reward
  • Your entries and stops are not predictable compared to time-based charts
  • The chart gave you between two and ten minutes to act
  • You work with buy-stop and sell-stop bracket orders: entering, entry, exit, and stop at once.
  • Targets show as dots on the chart
  • Stops are at red crossbars
  • Uptrends are framed in blue, downtrends in red
  • If you want to trail orders, use the red line on the chart

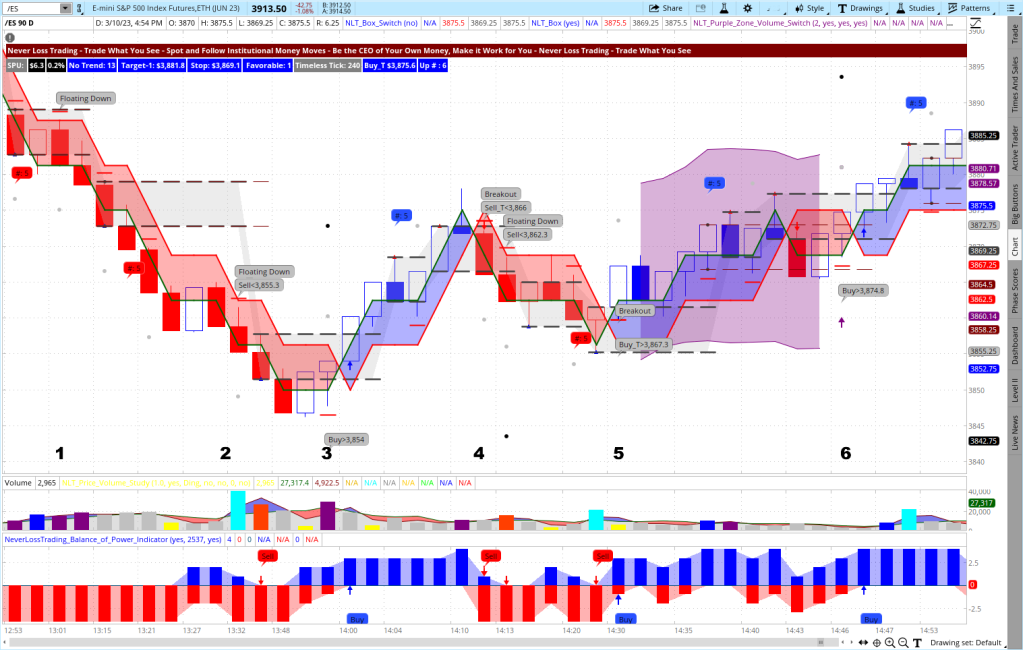
E-Mini S&P 500 Futures, NLT Timeless March 10, 2023

On the chart, we highlighted six trading opportunities and let you decide their outcome, reaching the gray dot or getting closed by the price move reversing to the red crossbar: high probability trading at its best.

If you like to experience how our systems work life:

contact@NeverLossTrading.com Subj.: Demo

NeverLossTrading is a trading education and software company that aims to help traders improve their performance and profitability in the financial markets by:

  • Personalized Coaching: in one-on-one sessions, you learn customized trading strategies that fit your unique needs and goals. This personalized approach can help traders better understand the markets and make more informed trading decisions.
  • Trading Software: NeverLossTrading offers proprietary software that provides real-time market analysis and trading signals. Our indicators are designed to help traders automate their trading decisions and execute trades with greater accuracy and efficiency.
  • Comprehensive Training: We provide extensive training and education materials to help traders learn the fundamentals of trading and develop the skills and knowledge necessary to succeed in the markets.

To succeed in trading, you best work with an experienced coach. Our #1 competitive advantage is the support and customer service we offer. Veteran traders have been through more ups and downs than you can imagine. So, experienced pros have probably experienced whatever you’re going through.

If you are ready to make a difference in your trading: We are happy to share our experiences and help you build your trading business. Trading is not a typical career, and you best learn from those who are long-term in this business to cope with the rollercoaster of the financial markets. We are here to help and provide feedback on what you might be doing right or wrong. Strive for improved trading results, and we will determine which of our systems suits you best. The markets changed, and if you do not change your trading strategies with them, it can be a very costly undertaking. The markets changed, and it can be an expensive undertaking if you do not change your trading strategies with them. However, you can make a difference with the right skills and tools!

Hence, take trading seriously, build the skills, and acquire the tools needed. Trading success has a structure you can create and follow.

Thomas Barmann (inventor and founder of NeverLossTrading)

www.NeverLossTrading.com

Disclaimer, Terms and ConditionsPrivacy | Customer Support

Saturday, March 11, 2023

Game Theory and Algorithmic Trading

Experience how game theory can help your trading by considering and following major players and their money moves. Our Algorithms make it visible to you, so you can trade what you see!

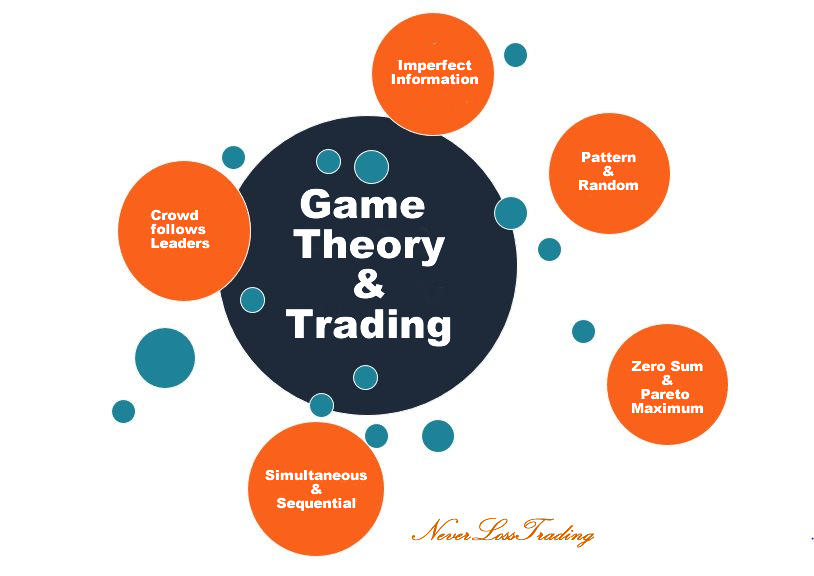
Game theory studies strategic decision-making: It helps analyze traders’ behavior in the financial markets. By understanding traders’ strategies and tactics, game theory can help investors make better decisions and improve their trading performance by analyzing the behavior of dominating market participants like institutional investors or market makers. Additionally, game theory helps develop trading strategies considering other market participants’ behavior.

Game theory seeks to explain the mathematical and psychological factors driving the decision-making of independent actors in a competitive setting. The concept is based on the premise that rational players in a game or a situation aim to maximize their payoff/profit and minimize their losses. It also looks at how these players make decisions in response to the different strategies employed by their competitors. The results of these analyses help predict human behavior in a strategic setting. For transferring this theory to the trading environment, we first describe variables influencing decision-making and the price prediction resulting from the analysis.

Variables in the Game Theory of Trading

Before the following investment taces with our algorithms, let us describe the players and their behavior:

The Crowd follows the Leaders

Institutional investors transact the vast majority of trades in the financial market. Who are those, and what is their intention?

Without naming all the players: a smaller number of investors influences many followers and the gatekeepers intermediate, while some players act in all three segments listed: like being pro traders, acting as market makers, and offering funds. By the sheer size of their investment, key influencers and followers leave a trace of their actions that you can spot and follow as a retail trader with the right tools. The Apple Inc. chart shows the price development between December 2023 and March 3, 2023. We will explain how we follow price signals institutions initiate, where our indicators measure underlying changes in supply/demand and formulate price move indications.

AAPL on a Daily NLT Top-Line Chart

The chart shows six potential trade situations with simple rules:

  • Do not enter at the exit level
  • Take profit at the dot on the chart
  • Do not open trades in NLT Purple Zones
  • Only trade when the spelled-out price threshold is surpassed in the price movement of the next candle

Situation-1: At the end of the NLT Purple Zone, Sell < 133.73 printed and was confirmed, leading to a trade to the Purple dot on the chart (target), and we disregarded the sell signals that came after, took profit and got ready for the next indication.

Situation-2: Two Buy > signals confirmed the next candle’s price movement and came to target (second blue dot in the sequence).

Situation-3: Buy Signal after the earnings conference, strong price move to the target.

Situation-4: Price drop after the dividend payout, as expected, so we disregard this signal

Situation-5: Confirmed sell signal, and we exit at the target dot.

Situation-6: Buy signal to be confirmed.

Imperfect Information

As good as you are informed, you will never beat the best analysts institutional investors employ. However, suppose you focus on the trace institutional decisions leave. In that case, you can act as a follower with an edge, getting in and out of entire positions faster than institutions can do.

Simultaneous and Sequential

When you act in the markets, you act simultaneously and sequentially after you receive an indication from your system where a price move might lead. So do other market participants; you must give yourself enough time to make proficient decisions under time pressure. Hence, if you want to day trade determining short-term what you want to do, you need to be highly trained and solid in your decision because you also trade against computers that are programmed and act to win. However, all is doable, but you will not beat a chess computer without knowing the game, and neither will you beat a trading computer without an adequate strategy. Price move indications are critical; however, applying essential trading strategies that allow you to act risk-limited and with leverage enables you to follow price moves to the up or downside from any account.

Pattern and Random

Most of the time, price development follows a pattern; however, there are times when it is random, and before acting, you must find a way to decide for the circumstances under which you operate. The system you use needs to deliver the decision-making base because guessing is not a repeatable principle that will give you an edge over others prepared to take your money. We follow historical price patterns and news-driven events. Earnings are a typical news-driven event. Hence, prepare and be aware of knowing about critical times to act so you are well prepared for trading; if you guess, your success will be random or nonexistent.

Hundreds of companies quarterly report earnings and initiate price moves you can spot and follow. We prepared a short guide on acting best by trading in and out of earnings conferences.

If you like to read the details, write us an email, and we will send you the strategy write-up:

contact@NeverLossTrading.com Subj.: Earnings

Zero Sum or Pareto Maximum

Zero-sum describes a situation where the total of the gains and losses of the players are equal. For example, a game between two people where one person wins $100 and the other person loses $100. On the other hand, a Pareto maximum is a situation in which gains or improvements made to one player do not come at the expense of another. This means that the total sum of the game can be greater than zero, meaning both players can benefit from the outcome of the game. We could run an extended theory, but we believe in the Pareto Maximum. Just think of all the additional government money printed that ended up in the financial markets as investment potential and drove the markets up; even so, we are now facing a time of a slight pullback.

Game theory is based on the premise that rational players in a game or a situation aim to maximize their payoff and minimize their losses. It also looks at how these players make decisions in response to the different strategies employed by their competitors.

When operating in the stock market at a 50/50 game, you will not have a chance to succeed long-term. Most retail traders never reach a decision-making base better than 55%. However, dwell on what this means:

  • With a 55% system, the odds are in your favor; however, winning six out of 10 trades based, your system probability is only 50.4% or random
  • If you work with a system that provides 65% forecasting accuracy, you have a 75.1% chance to win six or more trades out of ten, and now you have an edge.

These statistical facts are the brutal truth many retail traders now want to accept. If you invested $500 in your college education, how likely was your chance of making $100,000 a year from it? Knowledge and skills are needed to succeed. If you operate on a 50% chance, the likelihood for you to lose four trades in a row is only 6.25%. Hence, many retail traders celebrate occasional wins but do not follow a system that produces a high probability of a successful outcome.

You must run with a system that gives you high-probability trade setups to bring the odds in your favor. Retail traders without a high probability system fail because they lack the knowledge and experience to make informed decisions. Without a system to guide them, they are likelier to make mistakes and take too much risk. They may also lack the discipline to follow their trading plan and rules. Without a system, they may be more likely to chase losses or take on too much risk to compensate for losses. High-probability trading starts when a system can identify  and indicate a pattern that leads either to a:

  • Price turning point: opposite price direction to the initial price momentum or trend.
  • In the price continuation pattern, you start or add trades with the continuation pattern and spare opposite actions.

Under any circumstances, you are making decisions under uncertainty, and your choices can significantly impact your financial future. Hence, trading requires discipline, patience, and emotional control to make sound decisions and manage risk. The first step to conquering your fear of trading is to work with a high-probability trading system. A high-probability trading system has a high success rate and risk control. To put it in numbers: high-probability trading systems can forecast a price move in three dimensions with a probability of success at or above 65%:

  • Specifying entry conditions
  • Defining the target
  • Working with an adequate stop or trade adjustment level that allows the trade to come to target in the statistical price distribution of the underlying and accepting maximum risk requirements.

In our training programs, we teach methods of trade repair, where our brand name derived from, but Never Stop Loss Trading was a bit lengthy.

We also develop a business plan for trading success with our students, where you specify when to trade and when not, how often and what returns to strive for, and how to allocate risk by position sizing adequately.

Let us take a trading example adequate to 2023, where we are longer-term in what we call a price ambiguity, signified by an NLT Purple Zone: we frame uptrends in blue and downtrends in red. At times of price ambiguity, the red and blue mix and our indicator paint a situation of directional price ambiguity on the chart where price decisions are somewhat random than following a predictable pattern. What do you do? You stay out of trouble and commit shorter rather than longer-term engagements.

SPY, Weekly NLT Top-Line Chart

The chart shows that SPY remains in a purple zone starting the week of January 16, 2023, indicating that the market is not longer-term committed to a longer-term price direction. In the week of September 12, 2022, a short indication, Sell < $382.11, called for a short trading strategy that came to target in the next week. Our buy signal was confirmed in the week of October 17, 2022, leading to a strong upside price move that came to target on November 28, 2022.

However, when the market is not directionally committed longer-term, how do you start trading? First, you are scaling down in the decision-making timeframe. Next, you see a chart with NLT HF indicators that spell our crucial overall price turning points based on our volatility-adjusted short-term chart.

SPX, S&P 500 Index, NLT HF Price Turning Points

Imagine spotting and acting on the indicated price turning points; where would that get you?

In fourteen months, you had to act nine times to change the direction of your holdings. First, however, the question is:

Do you know suitable strategies to go long and short in any account (trade to the up or downside) without violating SEX regulations?

In our mentorships, we teach you the NLT Delta Force Concept, where you learn to either combine options with stocks or trade options on their own, knowing at any stage:

  • Which strike price to pick
  • Decide on the time of expiration
  • Specify the maximum price for put or call options or change the options trading strategy from single options trade to debit or credit spreads

If you prefer day trading, the current time confronts you with radical price moves on time-based candles.

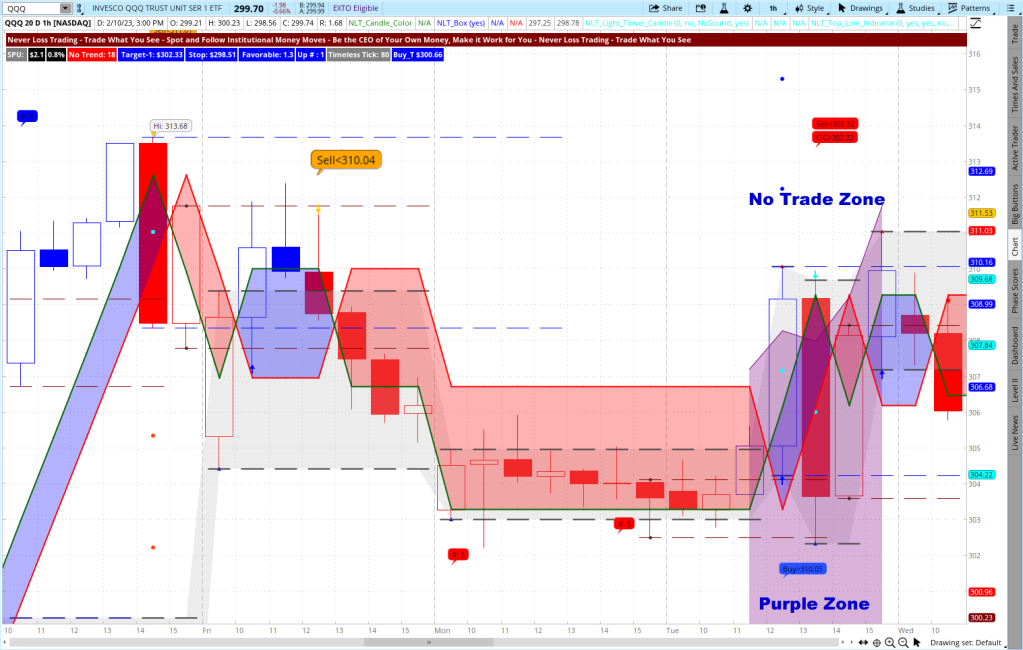
QQQ, 1-Hour NLT Top-Line Chart

The 1-hour chart just had one trading opportunity in five days, expressing the difficulty time-based day traders face. In the NLT  Purple Zone, opposite directional moves happened, and traders knew when to stay out of trades by having the zone.

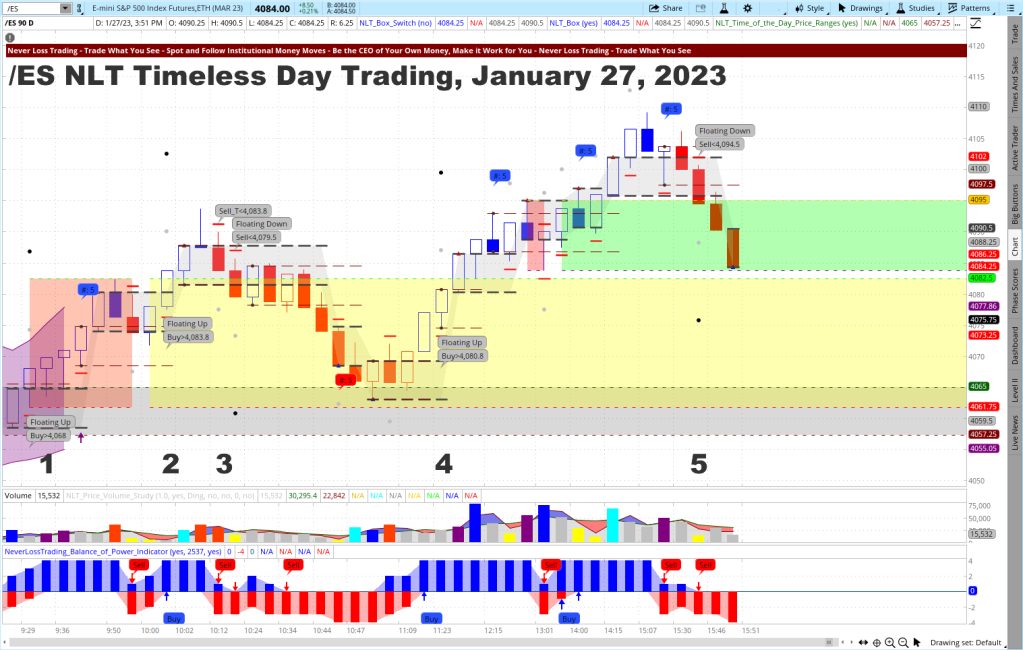
We have a solution: the NLT Timeless Concept. System-based, we specify price increments to trade for and act on NLT signals purely price-based. Here are two chart examples that combine NLT Top-Line, Trend Catching, and Timeless. The first chart shows five potential trade situations; each spells out a price threshold like Buy > $4068 and provides a basis to trade for a price change of about $300 of the underlying contract. To execute a transaction, we operate with buy-stop bracket orders. A trade only goes to the exchange when in the price development of the next candle, the set threshold is reached and the order executed: Five trade situations were highlighted, and all met their desired target (gray dot on the chart). Non got stopped (red crossbar on the chart).

E-Mini S&P 500 Index Futures Example

Next, we pick a crude oil futures example for the same day. The system also sets the price range to trade for, published daily. If you may, we will show you how our systems perform live:

Crude Oil Futures Example

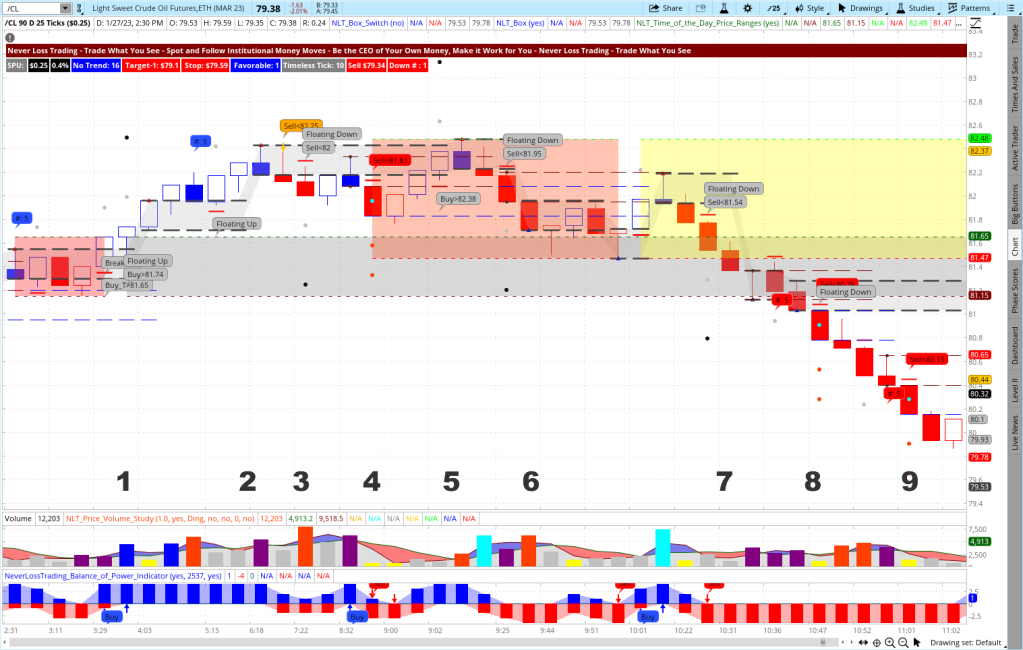
The Crude Oil Futures Chart shows nine trade situations with the same conditions and price thresholds. Accepting trades mechanically, without the evaluation to learn: six trade setups came to target (1, 2, 3, 5, 6, 7, 8, 9), and two got stopped (4, 5). Red crossbars identify the stop price level. Targets are at dots, and we only enter into a trade when the price threshold is ticked out in the price movement of the next candle.

Definitively, we have more recent charts and offer you a live demo: contact@NeverLossTrading.com Subj.: Day Trading

We hope we have demonstrated with the help of the game theory how you need skills and considerations in multiple dimensions to become a successful trader or investor. The following table summarizes the skills needed to succeed as a retail trader, and we support you in acquiring those. The issue to tackle: failing in one or more of the listed skills destroys your chance of making money. So make sure you get yourself checkmarks in the left column.

Trading and Investing Score Card

#RequirementDesired   Usual
1Following a System long-term100%   random decisions
2System Probability ≥ 65%   51% to 55%
3System-Defined Entries, Exits, Stops100%   situational
4Risk Limiting Strategies100%   no risk control
5Trade Finders (Scanners, Alerts)100%   random tips
6Action Plan (when to trade, how often, position sizing, return goal)100%   random decisions
7Risk/Reward Specification100%   nonexistent
8%-Risk Money Management100%   nonexistent
9Max Risk per Trade100%   nonexistent
10Portfolio Hedging100%   none
11Trading Journal and Review100%   nonexistent
12Aware of Market-Impacting News100%   disregarded

A dozen things to do. To make money trading, you must elevate yourself into the top 10% of retail traders. We are long-termers in the trading business and helped many to strive for their trading success and can assure you it is not coming without putting checkmarks on the left column of the above table.

To succeed in trading, you best work with an experienced coach and learn much about trading. Our #1 competitive advantage is the support and customer service we offer. We work one-on-one with you to specify what we teach to your specific wants and needs; hence, if your knowledge base is not expanding rapidly, you are doing something wrong. Ongoing education and mentoring are crucial to longevity in this business. Veteran traders have been through more ups and downs than you can imagine. So, experienced pros have probably experienced whatever you’re going through.

If you are ready to make a difference in your trading: We are happy to share our experiences and help you build your trading business. Trading is not a typical career, and you best learn from those who are long-term in this business to cope with the rollercoaster of the financial markets. We are here to help and provide feedback on what you might be doing right or wrong. Strive for improved trading results, and we will determine which of our systems suits you best. The markets changed, and if you do not change your trading strategies with them, it can be a very costly undertaking. The markets changed, and if you do not change your trading strategies with them, it can be a costly undertaking. However, you can make a difference with the right skills and tools!

Hence, take trading seriously, build the skills, and acquire the tools needed. Trading success has a structure you can create and follow.

Thomas Barmann (inventor and founder of NeverLossTrading)

www.NeverLossTrading.com

Disclaimer, Terms and ConditionsPrivacy | Customer Support

Saturday, March 4, 2023

Algorithmic Stock Price Move Forecast

Experience how to identify stock price movements with the help of modern algorithms and follow those with appropriate trading strategies.

More than 85% of all stocks are institutional held and traded. Institutions employ the most brilliant analysts to identify fundamental reasons or differences in moving investments from one asset to another. By the size of their investments, big money leaves a trace we can spot and follow as retail investors.

The great majority of all stocks develop with the overall index of the S&P 500. If we follow this logic, which would be appropriate investment strategies?

The answer to this question is twofold:

ActionChallengeNeed
You could invest in the overall market with an instrument like SPY and act on its crucial price turning pointsHow to identify crucial price turning points from start to end?A high probability system that helps you to identify the price direction from start to end
You find stocks with a potential for extraordinary price moves above or below the marketMarket scanners or alert services that system-based alarm you of individual price-moving stockFind a service or have scanners that provide you with highly probable situations with specified entries, exits and stops

Our summary certainly sounds simple, but there are three more dimensions to consider:

  • How can you protect yourself from drawdowns when your chosen entry point is wrong?
  • How can you leverage positive trades?
  • How can you participate in up-and-down moves, even from an IRA, where shorting stocks is prohibited?

Drawdowns

The biggest enemy of retail investors is the circle of doom: small gain, small gain, a significant loss.

How can this be prevented:

A) Stop

Always have a stop in a place that allows you to bring your trade to target, considering the statistical volatility of the stock. In conclusion, you always get stopped when you have a narrow stop, and your transactions rarely reach the target. On the other hand, if you choose a wide stop, the risk and reward of the trade will be out of balance and promise no positive result. Hence, it is not a simple undertaking, and we let our system specify the stop conditions for you, which is always in balance with the system probability. Therefore, you do not need to worry about doing all these considerations alone.

B) Trade Repair

The ability to repair a trade instead of accepting the stop-loss gave us our brand name; however, Never Stop Loss Trading was a bit lengthy. Hence, we teach our clients how to repair stock trades with the help of adding options positions that do not require additional margin and improve the transaction until you can leave it with a minimal loss or even turn losers into winners.

To explain the action, let us pick BIDU as a recent example of a client who did not follow our rules and shorted the stock instead of buying it.

BIDU, Daily NLT Top-Line Chart, Dec. 23, 22 to Feb. 24, 23

The chart shows five potential trade situations, but before getting into the details, let us explain some simple rules:

  • We trade with the overall trend and disregard the first opposite moves but accept the second ones, except if an orange signal calls for a top or bottom reversal.
  • Up-moves make higher lows, and down-moves lower lows, signified by the dashed gray lines on the chart (NLT Box Indicator).

Trade Situations and Strategies Explained:

Situation-1: Two NLT buy signals specified a long opportunity when the price threshold of $132.29 is reached in the price movement of the next candle: This was the fact, and the trade came to target at the dot on the chart, five candles after entry (also on the rate of expectation 1-5 candles).

Situation-2: A first opposite price move with a Sell signal should be disregarded by being a first opposite move and no orange signal. We cannot prevent the indication from showing, but we train you not to take it.

Situation-3: Confirmed Buy signal and strong upside move that also ended in a Buy Signal in the same sequence and such called for the end of the price move. The entire up-move was framed in blue, and our rule on the second blue buy signal is NLT Light Tower on the high, not a good place to buy; hence, fold the long trade. Unfortunately, we had a contrarian thinking client, going short BIDU on Buy > $136.45. First, his trade decision looked good, but then the trade exploded in the opposite direction. However, with the help of our trade repair strategy, he added to his trade, lived through the turmoil over earnings and cashed in premium, balancing his potential losses. Finally, instead of losing $25 per share, he closed his position on February 24 with a gain of $3/share. On the status of 200 shares, instead of losing $5,000, he turned his potential losing situation into a $600 profit.

Situation-4: Buy > $154.86 was a typical trend exhaustion candle, which we call an NLT Light Tower on the high, which calls for exiting the trade and lures others in to buy at the high. As you see, there are rules to learn with our chart, but they are learnable. Our trade repair method helps traders to live through times of turmoil when rules are not followed.

Situation-5: Sell < 154.10 was a strong early down NLT Signal and led to a strong down move of the stock; you could follow either by short-selling or by choosing an options trading strategy according to the NLT Delta Force Concept, which specifies:

  • Options trading strategy to choose
  • Strike price to pick
  • Time to expiration to select
  • Maximum price to pay or minimum premium to collect

Again you follow clear guidance, and guessing is not an alternative for you to choose. Indeed, there are rules and trading strategies to learn, and just blindly following chart indications will not do it. The NLT Top-Line program comes with 20 hours of individual training and three months of coaching, and NLT Alerts make you fit for today’s markets. We teach individually at your best available days and times. In more than ten years, we have not seen two clients with the same:

  • Risk tolerance
  • Income expectation
  • Affinity to assets: stock, options, futures, or FOREX
  • Decision-making basis
  • Available time for trading
  • and we can easily add to this list.

Hence, only individual training will cover your specific want and needs. The following chart for AAPL is simple to read, and we let you conclude the highlighted trade situations:

AAPL, Daily NLT Top-Line Chart

The red line on the blue or red framed price channel works as a trailing stop line on the chart. So, by our rules, you should have traded at three of the four situations, and we will let you decide which those are. But if you want to take reference with us:

contact@NeverLossTrading.com  Subj.: AAPL

Let us, at this point, share an NLT HF chart, where we highlight price turning points of the S&P 500.

SPX, NLT Volatility Adjusted Price Turning Points

This chart ended on 2/3/23, and when you check back, what the market did after our sell sign: it sold off.

What would such instruments, including the appropriate strategies to act on crucial price turning points, do for your trading?

We could add example over example, but we want to offer you to go through them in a live demo to experience what is possible:

contact@NeverLossTrading.com   Subj.: Stock Demo

We are long-termers in algorithmic trading. Our systems have AI components and help you to form sound decisions at high-probability setups, but there are rules to learn and follow. We teach those in one-on-one sessions at your best available days and times.

We helped many strive for their trading success and assure you it is not coming without sound knowledge and skill.

If you are ready to make a difference in your trading, we will share our experiences and help you build your trading success. Trading is not a typical career, and you best learn from those who are long-term in this business to cope with the rollercoaster of the financial markets. We are here to help and provide feedback on what you might be doing right or wrong.

Strive for improved trading results, and we will determine which of our systems suits you best.

The markets changed, and if you do not change your trading strategies with them, it can be a very costly undertaking. However, you can make a difference with the right skills and tools!

Imagine if you could spot and act on the price turning points our indicators put on the chart.

Hence, take trading seriously, build the skills, and acquire the tools needed. Trading success has a structure you can create and follow.

We are looking forward to hearing back from you.

Good trading,

Thomas Barmann (inventor and founder of NeverLossTrading)

www.NeverLossTrading.com

Disclaimer, Terms and ConditionsPrivacy | Customer Support