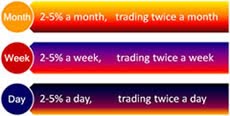
Summary: In trading or investing, the crucial decision is how much risk you accept per transaction. The trader who finds a solid balance between risk, reward, and participation rate has the highest expectancy for constant income from the financial markets. Experience a guideline to manage risk.
By our definition, risk-averse describes a trader or investor who chooses the act under conditions that keep a system-specified balance between risk and reward instead of aiming for higher returns.
The difference between trading and investing is just the expected time to hold an open position; behavior-wise it is the same:
- Day Trading: opening and closing positions on the same day
- Swing Trading: holding positions for multiple days
- Investing: holding positions for weeks or months
Hence, we use the terms trading and investing as synonymous.
How to define the risk in trading?
A simple definition would be the difference from entry to stop. However, where to place a stop?
The risk of a transaction depends on the statistical price volatility of the underlying instrument that you forecast:
- If you leave too little room for price volatility, you will get frequently stopped, and your trade infrequently comes to target.
- If you leave too much room, the balance of risk to reward will not be acknowledged, and you face drawdowns and not achieve your goals.
Capital preservation is vital; hence, one investment should not put you on a higher than 2% or maximum 5% risk of your account holdings.
You want to establish a behavior with a near-zero chance that your base investments will be lost.
Multiple variables come into play to define the investment size per transaction, where your position size should be related to the strength of the signal you decide to trade.

Risk adversity varies by instrument: Stocks, Options, Futures, FOREX, and we pick an example for each category string with a comparison of three stock market index futures contracts to compare them:

Hence, a risk-averse trader favors the E-Mini S&P 500 futures contract over the E-Mini NASDAQ or DOW, while the three instruments show highly correlated price moves.
To quantify our selection: The following table shows the NASDAQ 100-related Futures contract showed double the volatility of the S&P 500 and DOW 30-related futures contract.

By the /ES offering a close to 10-times higher liquidity than the /YM, the /ES is the instrument of choice for a risk-averse trader.
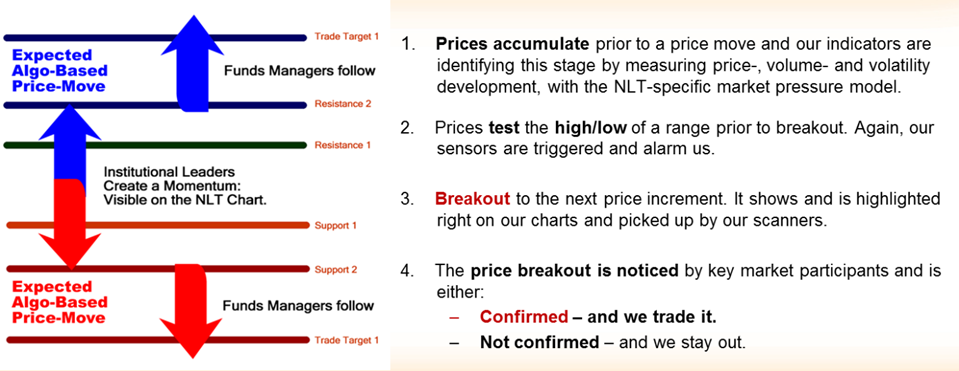
With the help of our indicators, we highlight critical price turning points and differentiate the signal strength.
In the following chart example, you see a signal combination that follows the NLT Timeless concept:
- Each candle is formed by a system-defined price base that will consider actual volatility.
- Time is no critical element, only price change is tracked and defines entry and exit in a transaction.
We put on the chart a combination of NLT Top-Line, Trend Catching, and Timeless Indicators. Our focus is to look and act on two happenings, whatever comes first:
- A sign that shows a floating print means the price is trading towards open space with less resistance
- Signals showing a breakout sign signify that the price leaves a prior price containment
E-Mini S&P 500 Day Trading Chart August 5, 8, 2022
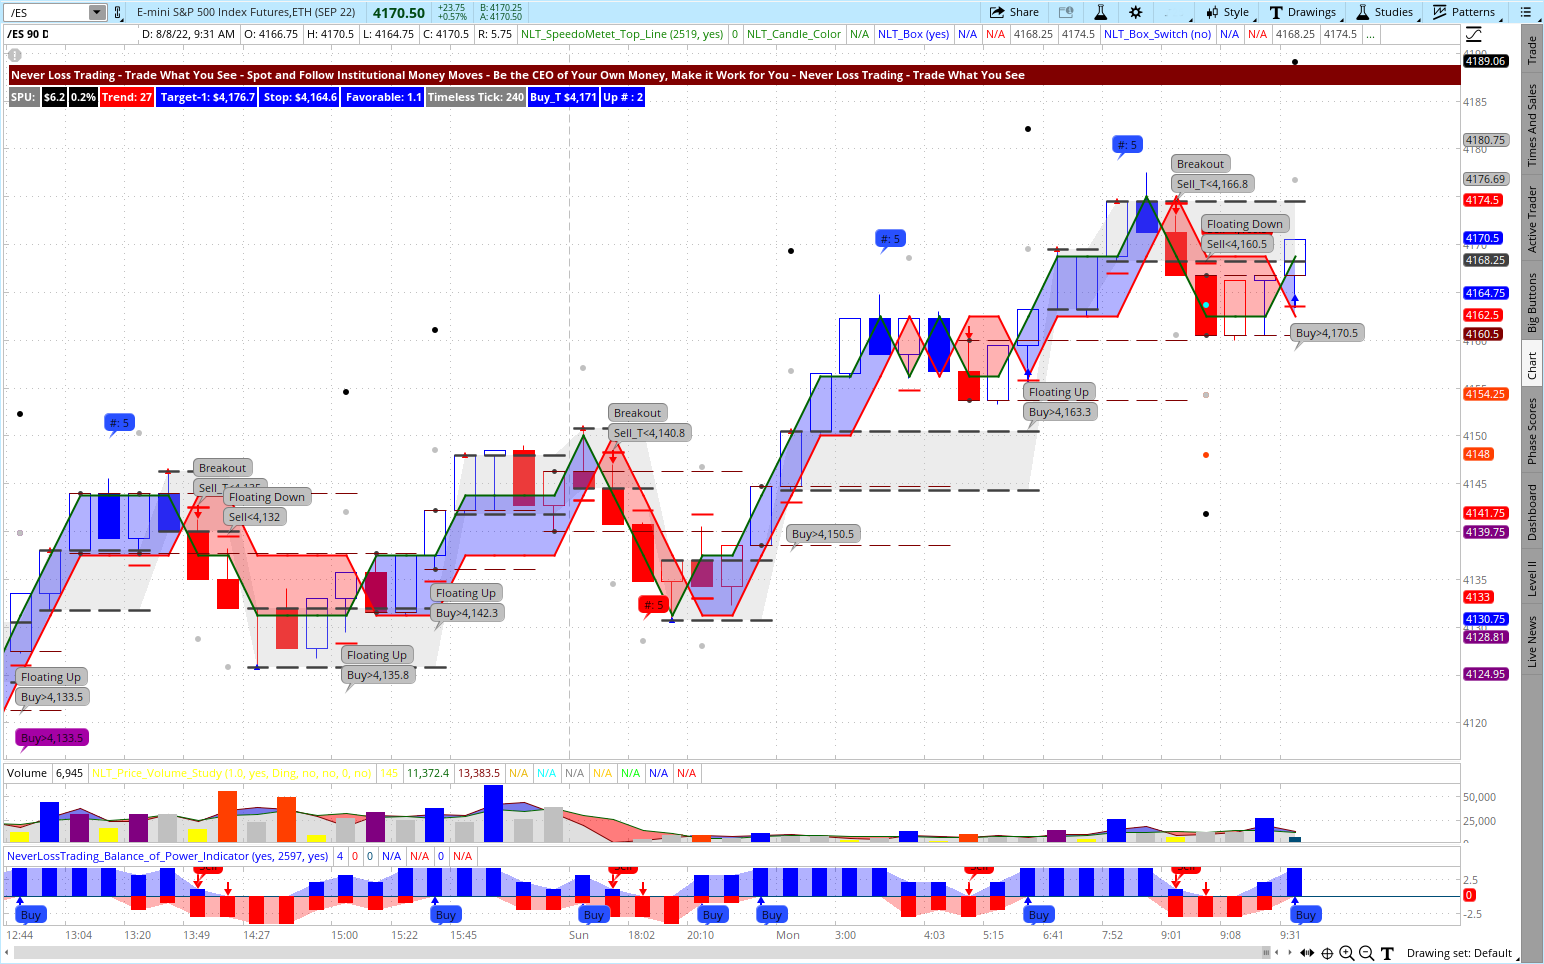
You see multiple signals and signal combinations, where we take a mechanical approach. Check the chart and find six price turning points to act on:
- The dot on the chart is the exit
- The red crossbar signifies the stop
- When you are in a trade to target, disregard the same directional or opposite-facing signals
- The system only prints signs where risk and reward are in balance with the system probability of having a positive expectation value
With the NLT Timeless concept, we help you put five trading decisions in one spot:
- Acting on buy-signals above the set price threshold through buy-stop orders
- Acting on sell signals below the set price threshold through sell-stop orders
If you are interested in a longer-term perspective, check the following chart, where one price move to target stands for a value change of the underlying E-Mini S&P 500 contract of about $7,500.
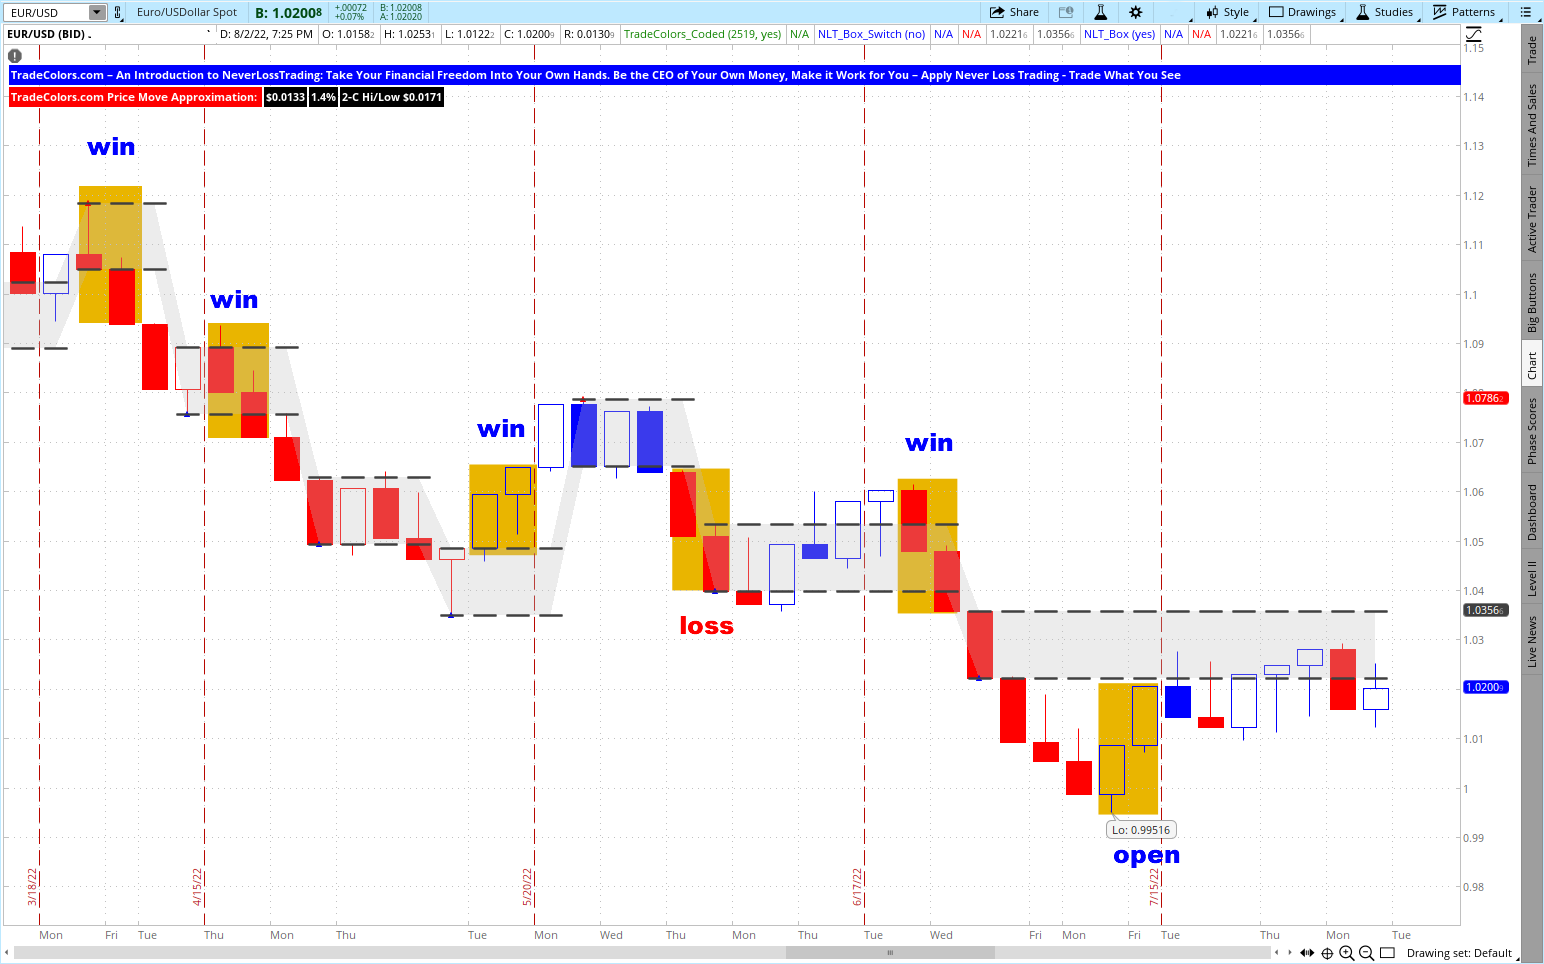
/ES Swing Trading Chart March – August 2022
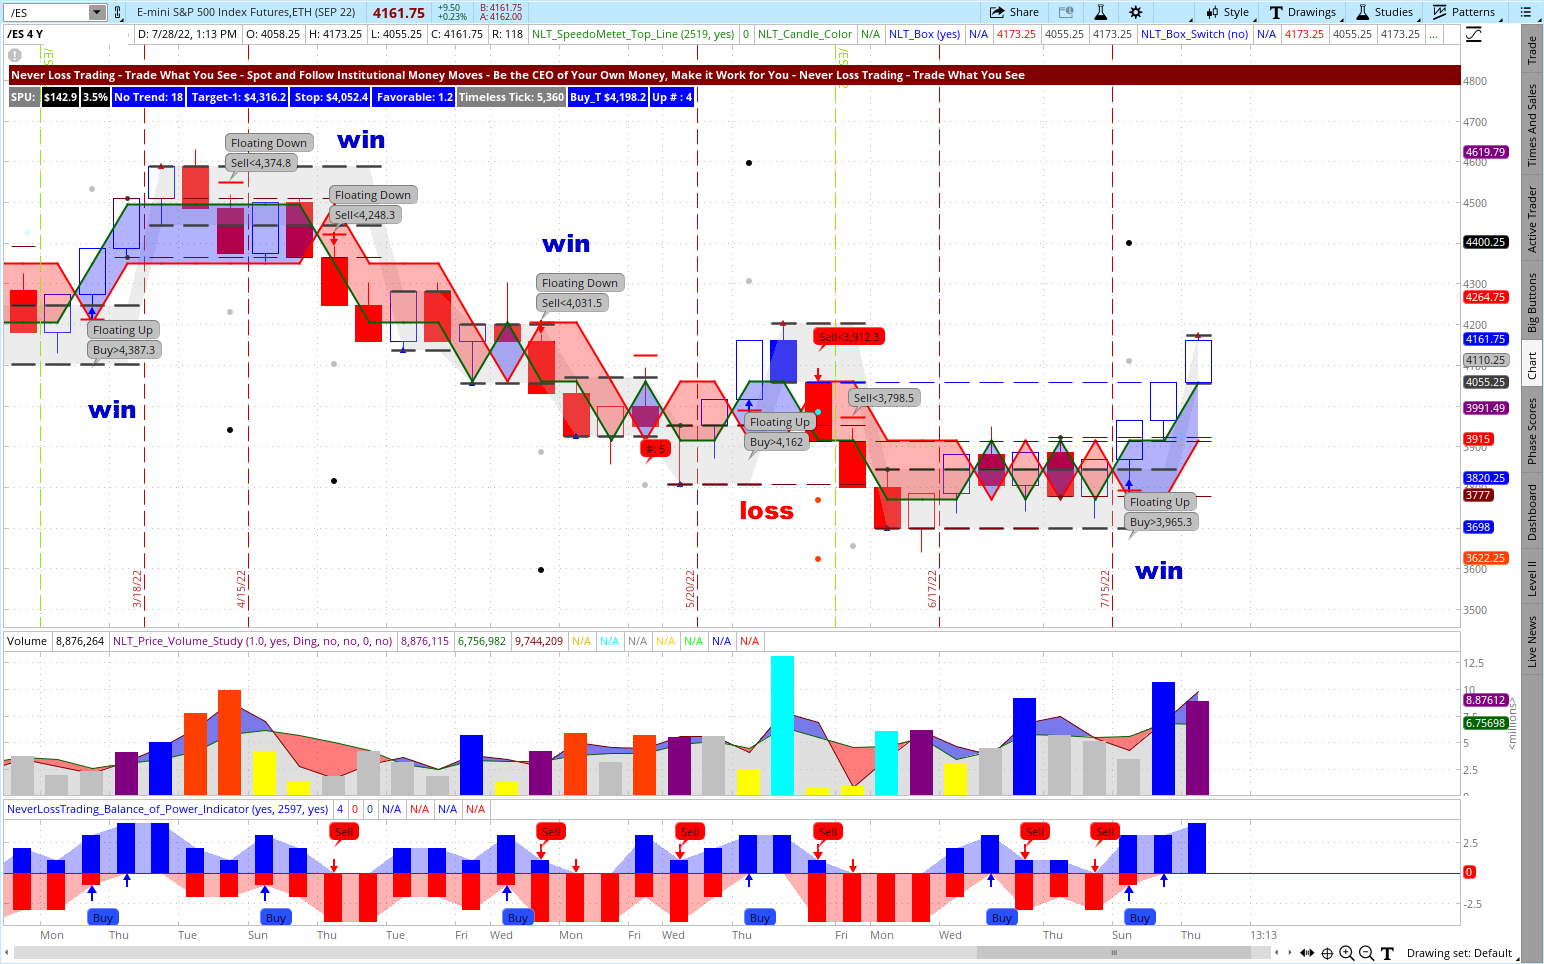
With the NLT Timeless Concept, we consider volatility and pair solid price moves with acceptable risk/reward units. Hence, volatility is an inherent component of the system decision.
Considering mechanical rules (accepting each signal), the above chart showed five critical price turning points in the last four months. Four were winners, and the losing trade could have been prevented with the knowledge we teach in our mentorship.
If you are a stock trader, the following should be considered as a risk-averse trader or investor:
- Select stocks with a volume above 2 million transactions per day
- Favor NADAQ stocks over NYSE because NYSE stocks have more broker control
- Choose stocks with a solid options chain to allow a form of leverage or protection
- Have a portfolio hedge in place, so you are protected in an overnight event that would harm your holdings
- Pick stocks with individual price moves rather than stocks that go with the overall market (our NLT Top-Line indicators show when this is the case)
- Consider the historical trend of the stock to understand what other market forces assume
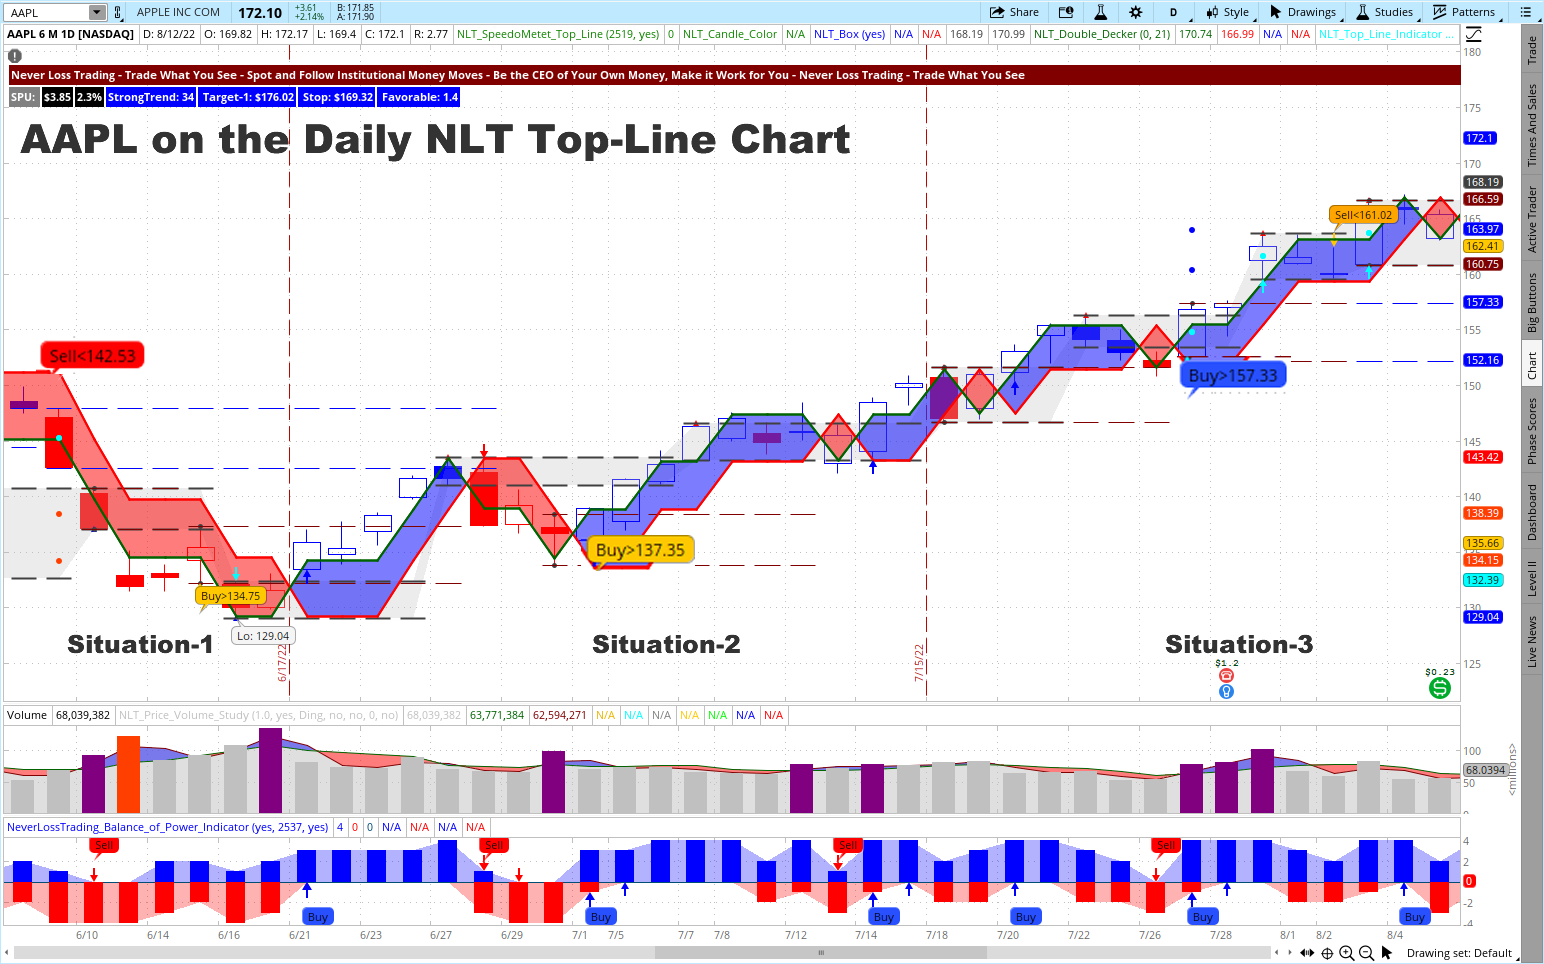
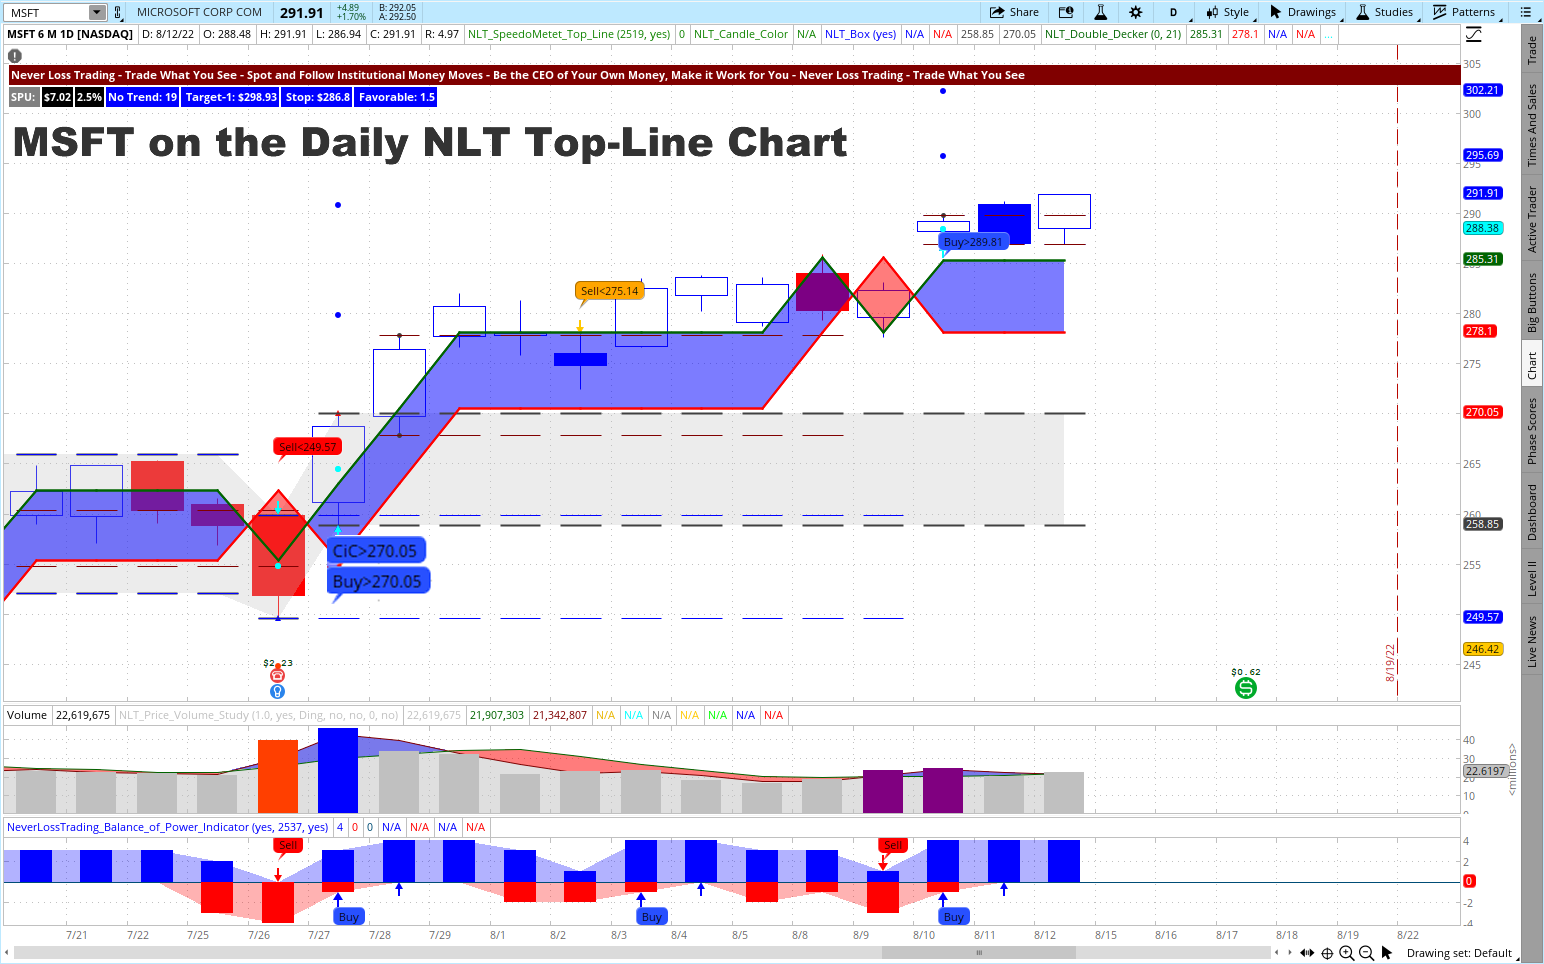
AAPL Daily NLT Top-Line Chart June to August 2022
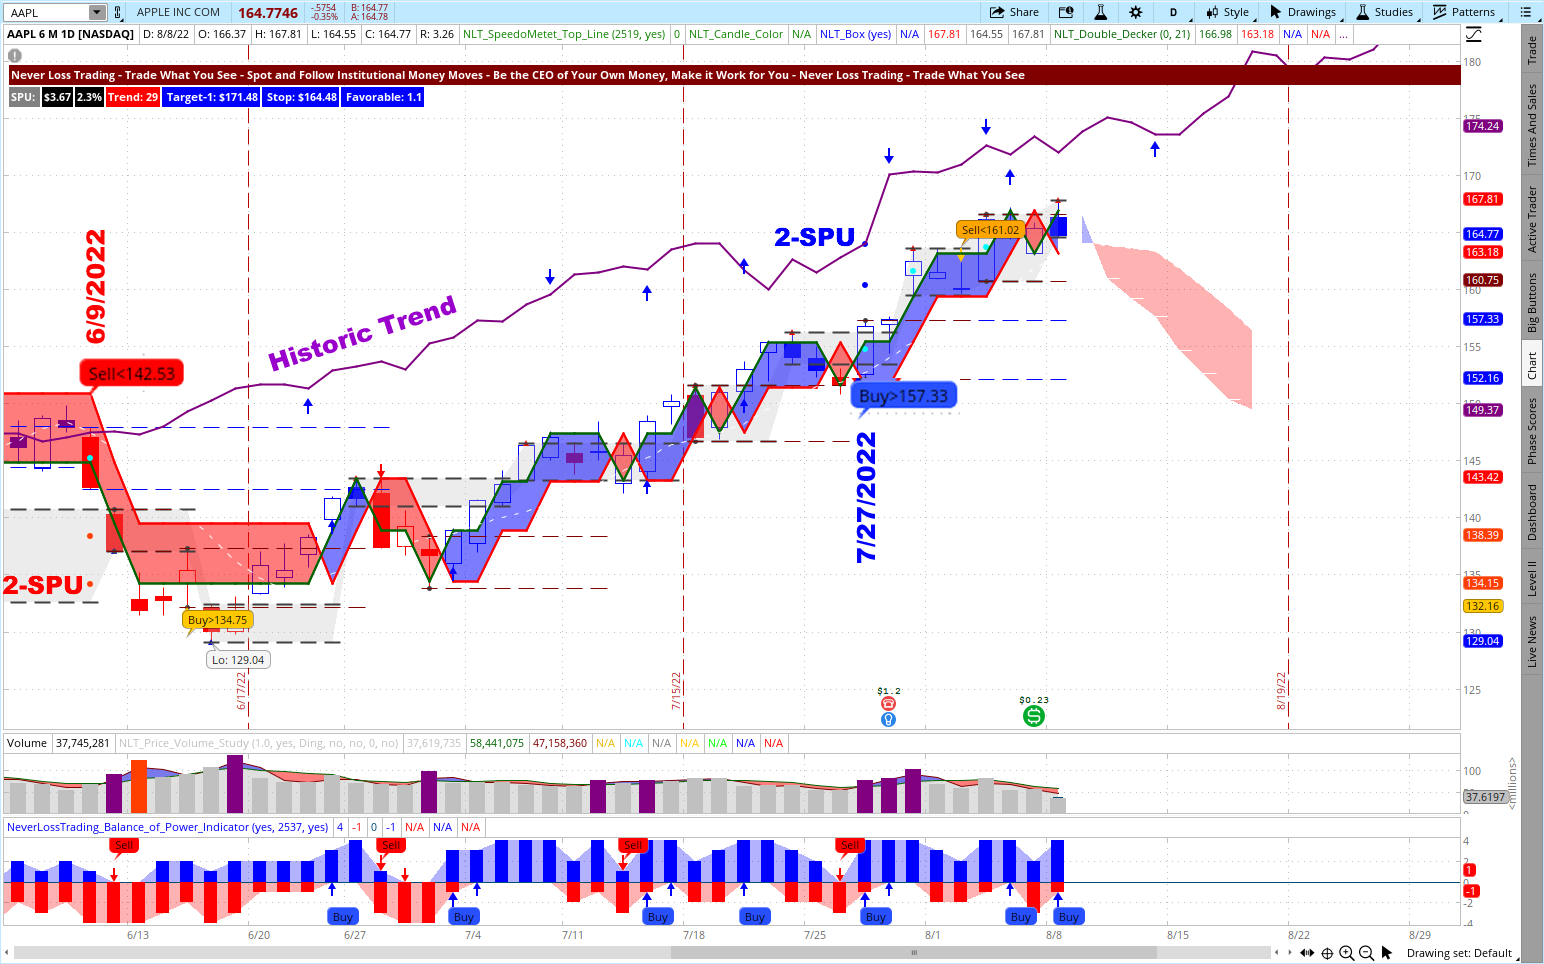
On, the chart, we highlighted two strong trade situations: June 9, with a short signal, and July 27, 2022, with a long signal. The signal direction was confirmed in both cases, and the price development followed the historical trend. We printed a sign at the 2-SPU price level on the chart: this is where a risk-averse trader takes profit, assuming that there is only a 15% chance for the price to go higher or lower.
A risk-avers stock trader could have also followed the price moves with the NLT Delta Force Options Trading Strategy, which offers you the following advantages:
- Investing less than 3% of the value of the underlying
- Specifying the max risk at entry, even in case of an opposite gap
- Strong upside leverage at the 1-SPU and 2-SPU exit level
Combining stocks with options is another way to trade risk-averse, and the concept of trade repair gave us our brand name, but Never Stop Loss Trading was a bit lengthy.
We know and acknowledge that every trader is different. Hence, we tune our systems and teach to your specific wants and needs, supporting you to turn yourself into the trader or investor you want to be, teaching one-on-one at your best available days and times.
FOREX trading allows for risk-averse decisions. With the right broker on hand, FOREX will enable you to partition your position size always to stay compliant with maximum risk units. As a risk-averse FOREX investor, you pick pairs with narrow bid/ask spreads and lower range volatility. Typical pairs that fit this scope are EUR/USA, AUD/USD, USD/CAD, and USD/JPY.
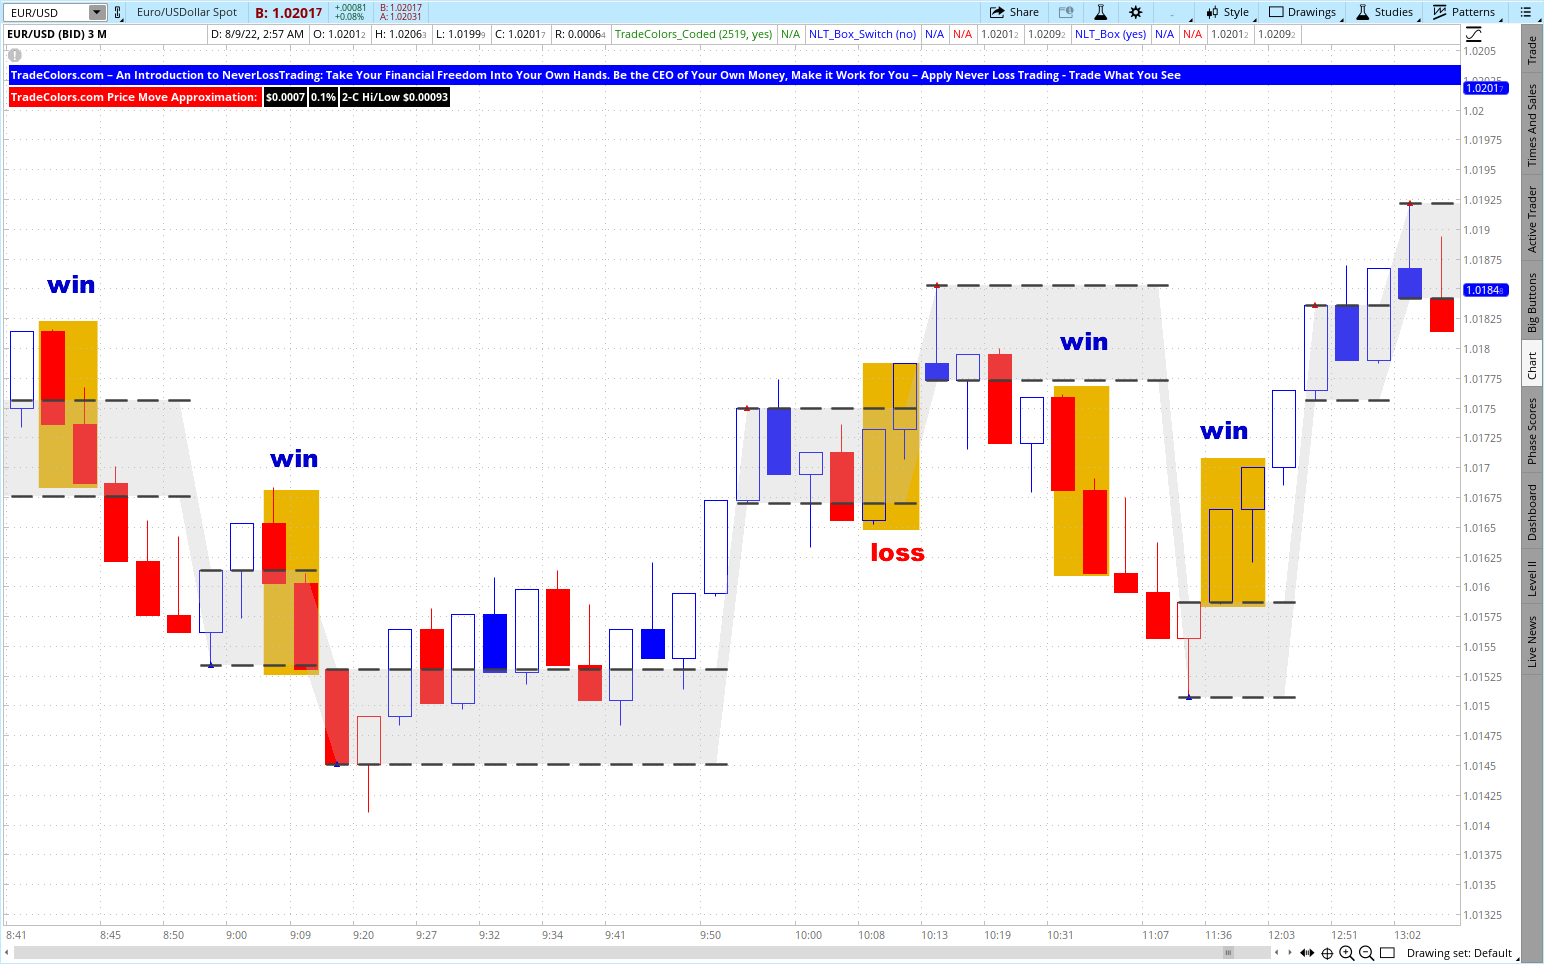
Our entry-level system for algorithmic trading is called TradeColors.com. You trade when the high/low of a first new candle color combination is ticked out in the price movement of the next candle, and the system spells out the target or price distance to trade for on the upper left dashboard.
Let us take a day trading chart and swing trading example:
EUR/USD on the TradeColors.com Timeless Chart (day)
EUR/USD on the TradeColors.com Timeless Chart (swing)
There are rules to learn, and we will spend time together learning how to decide based on our indicators and setups.
Let us share some of the learning elements to take away from our training and coaching sessions, which vary based on the system you choose, from four to twenty hours of teaching.
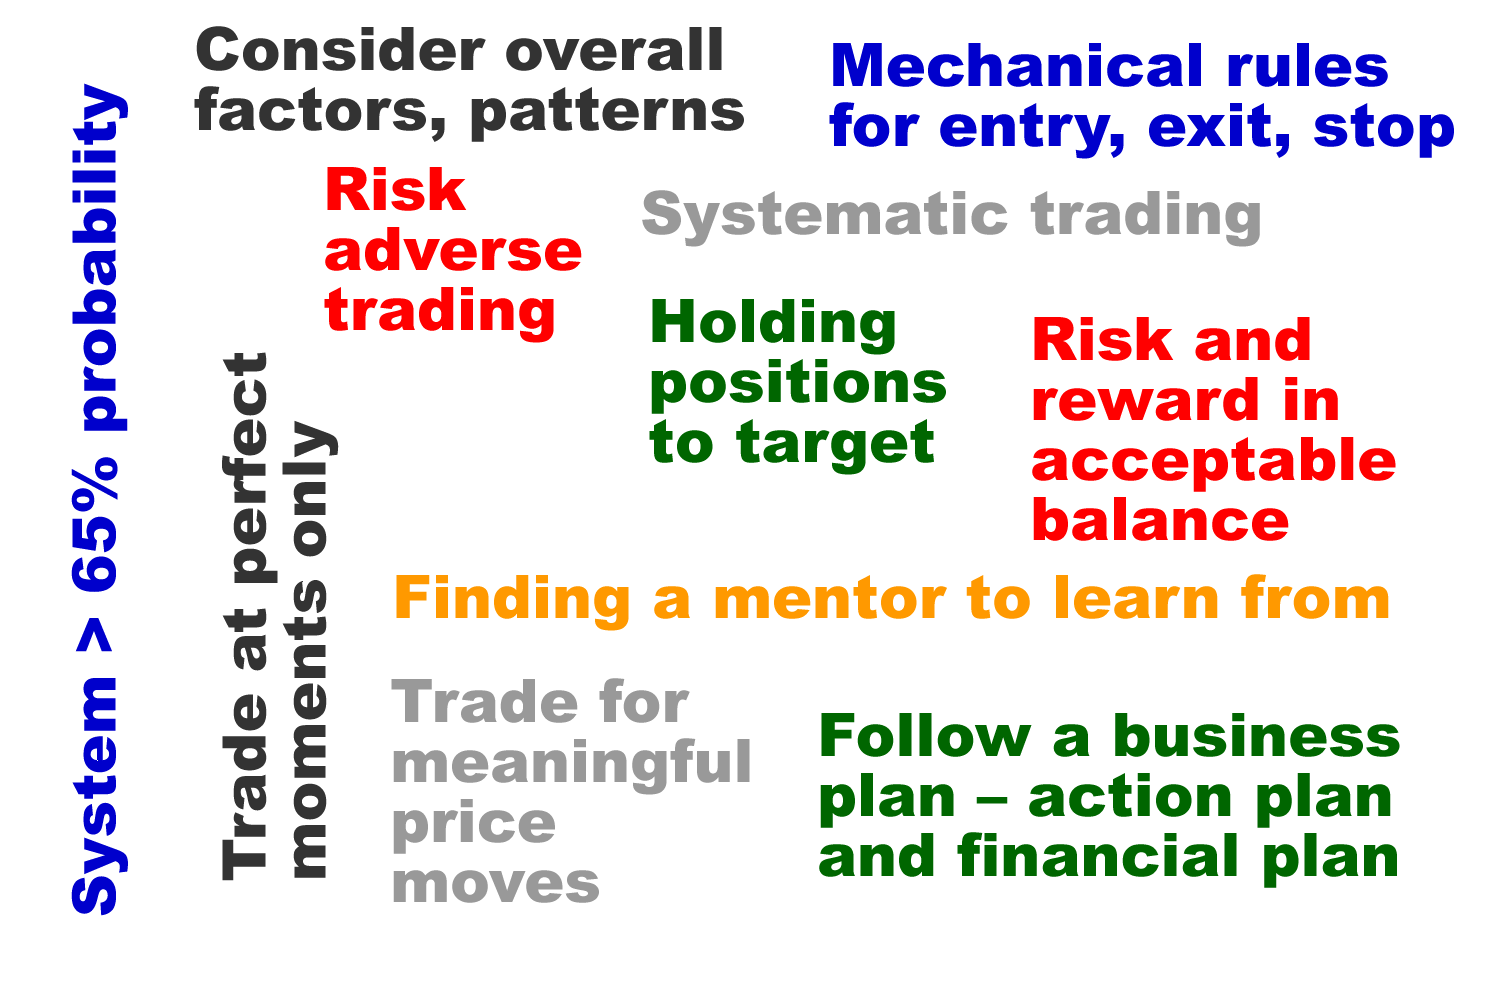
Summary of learning elements:
- Acting with a system probability > 65%
- Mechanical rules for entry, exit, stop
- Trade at perfect moments only
- Consider overall factors, patterns
- Risk and reward in an acceptable balance
- Risk-averse trading
- Holding positions to target
- Do not add to losers
- Stick with a trading strategy. Follow a business plan – action plan and financial plan
- Trade for meaningful price moves
- Systematic trading
- Having a mentor to learn from
We also help you to journal your trades. Such a journal provides excellent feedback on how you are developing, and you find a perfect example in this article on our Blog: How to Control Your Trading Results
To succeed in trading, you best work with an experienced coach and learn much about trading. Our #1 competitive advantage is the support and customer service we offer. We work one-on-one with you to specify what we teach to your specific wants and needs; hence, if your knowledge base is not expanding rapidly, you are doing something wrong.
Ongoing education and mentoring are crucial to longevity in this business.
Veteran traders have been through more ups and downs than you can imagine. So whatever you’re going through, experienced pros have probably experienced it already.
If you are ready to make a difference to your trading:
contact@NeverLossTrading.com Subj: Demo.
We are ready to share our experiences and help you build your trading business. Trading is not a typical career, and you best learn from those who are long-term in this business to cope with the rollercoaster of the financial markets. We are here to help and provide feedback on what you might be doing right or wrong.
Strive for improved trading results, and we will find out which of our systems suits you best.
We are happy to hear back from you,
Thomas Barmann (inventor and founder of NeverLossTrading)
Disclaimer, Terms and Conditions, Privacy | Customer Support