Spot and Trade Institutional Money Moves

Algorithmic Trading with Human Interaction for:

Day Traders, Swing Traders, Long-Term Investors

Wednesday, December 29, 2021

Women and Men in Trading, what is the Difference?

Summary: Men and women take a considerably different trading approach, and all of us can learn from this to increase our return expectations by following more probable success principles.

Retail traders show a dominance of men with interest and actual trading: By our analysis, women represent less than 20% of the active traders. There are various theories as to why; however, we want to focus on sharing if we see a considerable difference in the trading approach and what we can learn from it?

Men and Women in Trading by NeverLossTrading

Base Hypothesis

The difference in the behavior of men and women produces a discrepancy in the return expectation from trading or investing.

However, can we observe and determine fundamental differences between male and female trading behavior?

Let us relate to some statistics by the University of California and our research of working for more than ten years with individuals, teaching and coaching how to trade with the NeverLossTrading systems:

Men trade with a 45% higher frequency than women and produce lower average returns.

This finding would lead to the following deduction:

The less a person trades, knowing what they do, the more likely they will do well. 

Reasons for fundamental differences of men and women in trading:

  • In trading, your system is supposed to tell when to buy or sell; however, at times, there is nothing to do, and men feel they done nothing if they did not trade while women more willingly comply with the rules of only trading when the perfect moment is there.
  • Women consider more factors in their trading decisions. Opposite to this, men have a higher tendency to act overconfident and impulsively. They take greater risk without looking at the bigger picture and tend to urge revenge trades after they booked a losing trade: now it has to work, period!
  • Women traders create greater financial returns by acting less frequently and holding positions to the system-specified target. On the other hand, men often tend to cut their trades to targets short (anticipating, it could turn in the opposite direction).
  • Women are more likely to deliberate before placing a trade and don’t enter until their belief in the trade is high, often waiting for multiple indicators to be in sync and then act.
  • Generally, women don’t take sub-optimal setups as often as men, producing a higher winning percentage.
  • Men are more prone to refusing to admit when they are wrong and hold on to losing trades longer than they should, hoping that they will turn around. On the other hand, women tend to admit mistakes more quickly and are more willing, and they tend to adhere to a strategy more strictly and are better at cutting losses. 
  • Men tend to seek entertainment in trading, where they like to act on very short-term happenings, not considering that by the pure setup of the trade, considering slippage and commissions, they trade for action and will never make a return. On the other hand, women are faster convinced and apply a meaningful approach to act at situations and setups where the odds are in their favor.
  • Conserving capital is essential in trading, and the available data suggests that women tend to be more risk-averse than men. As a result, they trade less often and execute less risky strategies.
  • Female traders may also be more likely to focus on a smaller asset base, allowing for more knowledge gathering and better management of trades with fewer areas to watch. 
  • Some researchers consider men to be more competitive. In contrast, women might avoid getting caught up in the adrenaline rush of the moment and focus instead on their eventual spending goals.
  • Trading is a male-dominated arena; women who choose a career in trading are still in the minority and can therefore be more determined to succeed, including to dedicate time to practicing strategies and finding a mentor whose advice they feel comfortable heeding.

Let us put our findings into a summary graphic:

Crucial Trading Success Factors

Success Factors by NeverLossTrading

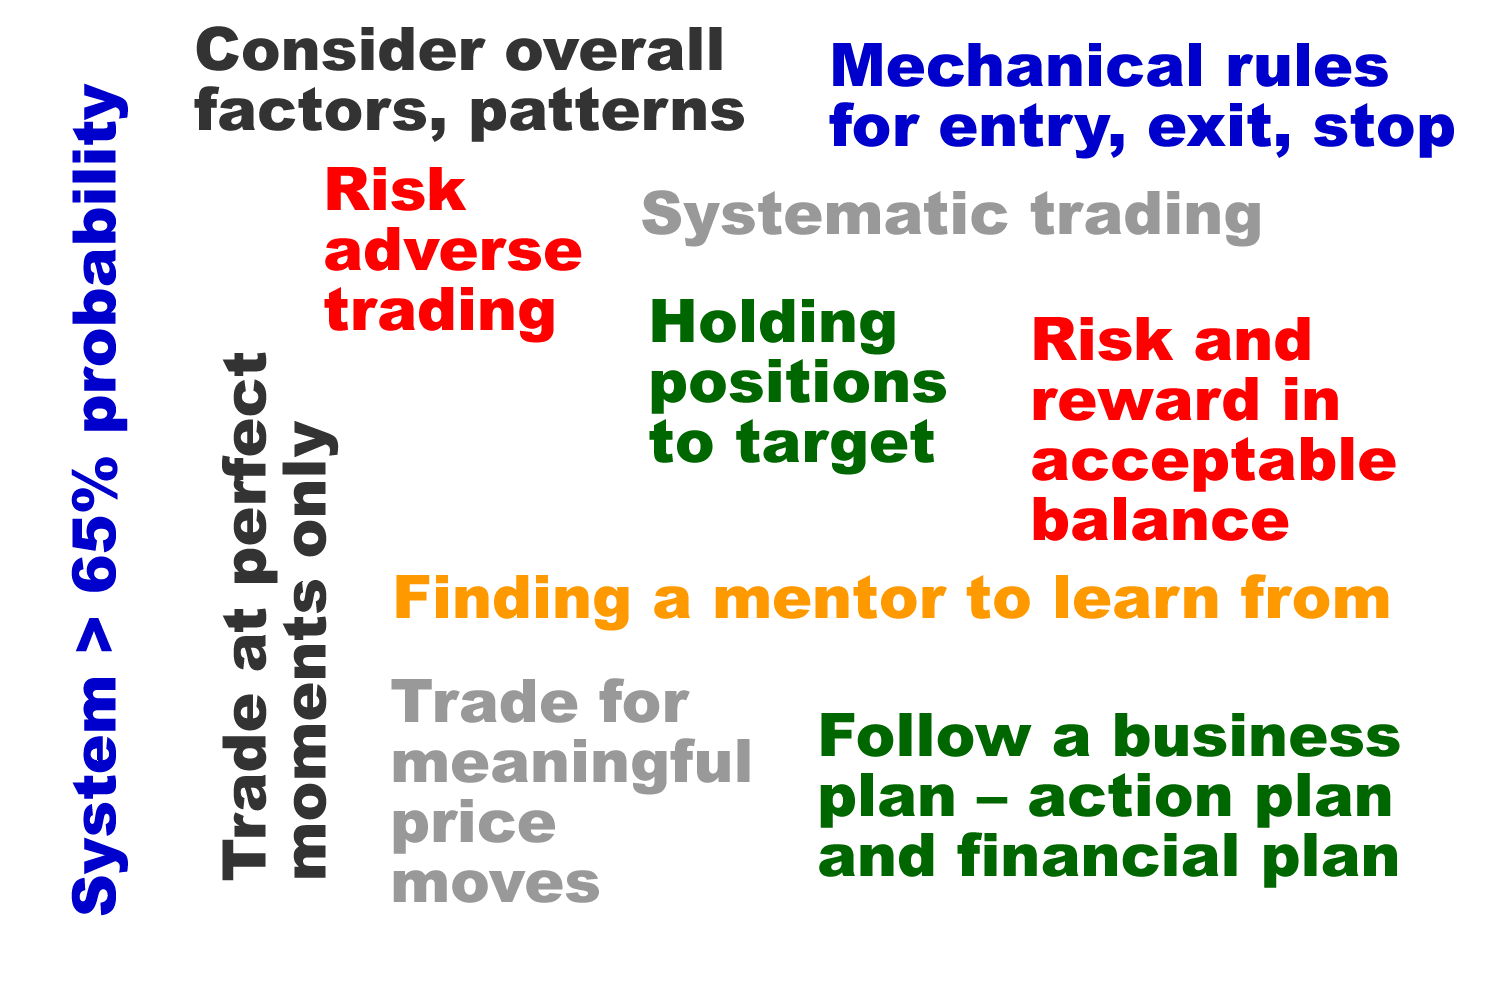
Now that we pointed out many differences, the conclusion for you are a reader, male or female, is:

  • Trade with a high probability system gives you mechanical rules for trade entry, exit, stop, or adjustment.
  • Have a business plan for trading that you stick to, containing an action plan (when and how to trade, when not) and a financial plan (assets, timeframes, return opportunities and the financial goal).
  • Analyze the situation well and take fewer and high quality/high probability trades only.
  • Do not add to losing positions and hold your winners to target.

In our mentorships, we help you have all this in place, but you still have to work with your inner nature, in particular, when you are a man. Please take a look at the overview of what we want to share with you when you are working with us:

NeverLossTrading Mentorship Program Elements

Mentorship Learning Elements by NeverLossTrading

At an algorithmic trading house, we want to quantify the difference in trading behavior and share some trade examples, building an income expectation model based on the NLT Timeless Concept. A concept where we focus on trading for pre-defined price increments rather than deciding on a time-based perspective.

Our goal is to determine with a quantitative model which behavior is more likely to lead to higher returns, and we choose day trading with futures. If you are not considering futures trading by today, let us quickly give you in a short overview the advantages futures trading can provide you:

Advantages of Futures by NeverLossTrading

We hope this simple graphic explains why futures trading is essential as an investment vehicle. However, there is another dimension to it: You can protect your assets using futures contracts for overnight hedging, and we explain all this and more in our mentorships.

With NLT Timeless Investing, we anticipate holding positions between one to five weeks, striving for targets above 100 Points (a price change of the underlying E-Mini contract ≥ $5,000).

 E-Mini S&P 500 Futures, NLT Timeless Investing Chart

Long-Term Timeless Trading Chart by NeverLossTrading

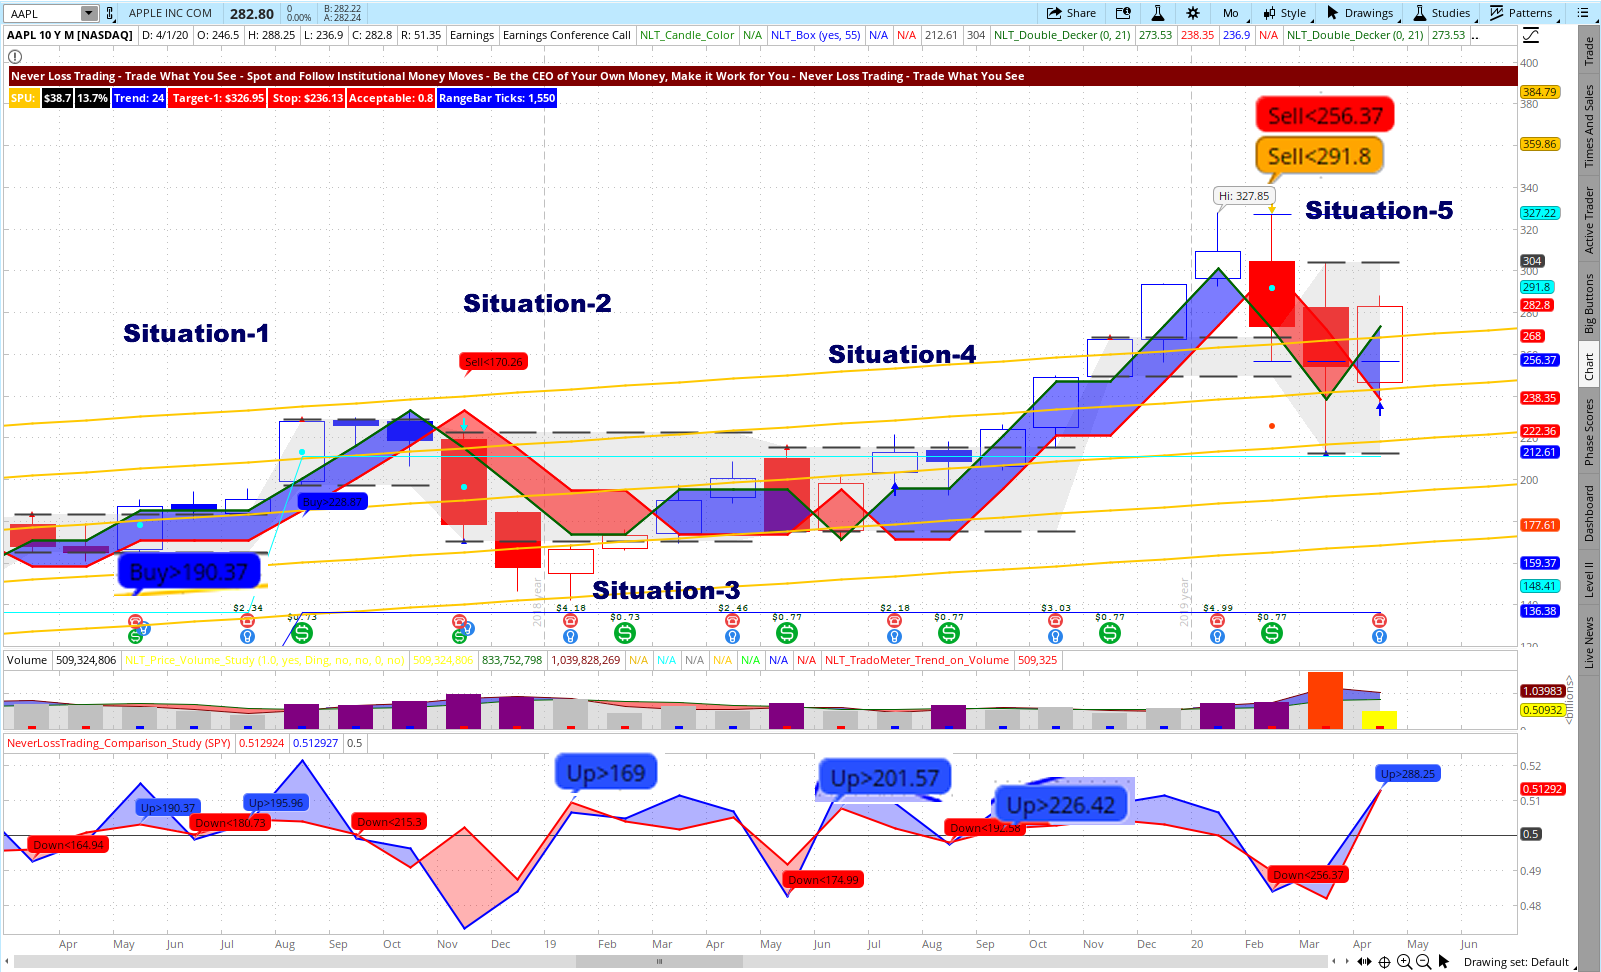
From September 2020 to the end of July 2021, the NLT Timeless Indicators painted multiple trade situations on the E-Mini S&P 500 Futures chart. By following the rules, the trade exit was either at target, stop, or close candle #5. The chart shows eight trade situations:

  • Seven winners
  • One loss

The NLT Timeless trading concept lets you act different, unpredictable and at high probability setups, with pre-specified reward/risk scenarios, providing you with opportunities for:

  • Day Trading (multiple trades per day)
  • Swing Trading (holding between one and five days)
  • and Longer-Term Investing (holding for one to five weeks)

We definitively prefer and recommend taking part in each of those trade perspectives, producing multiple streams of income.

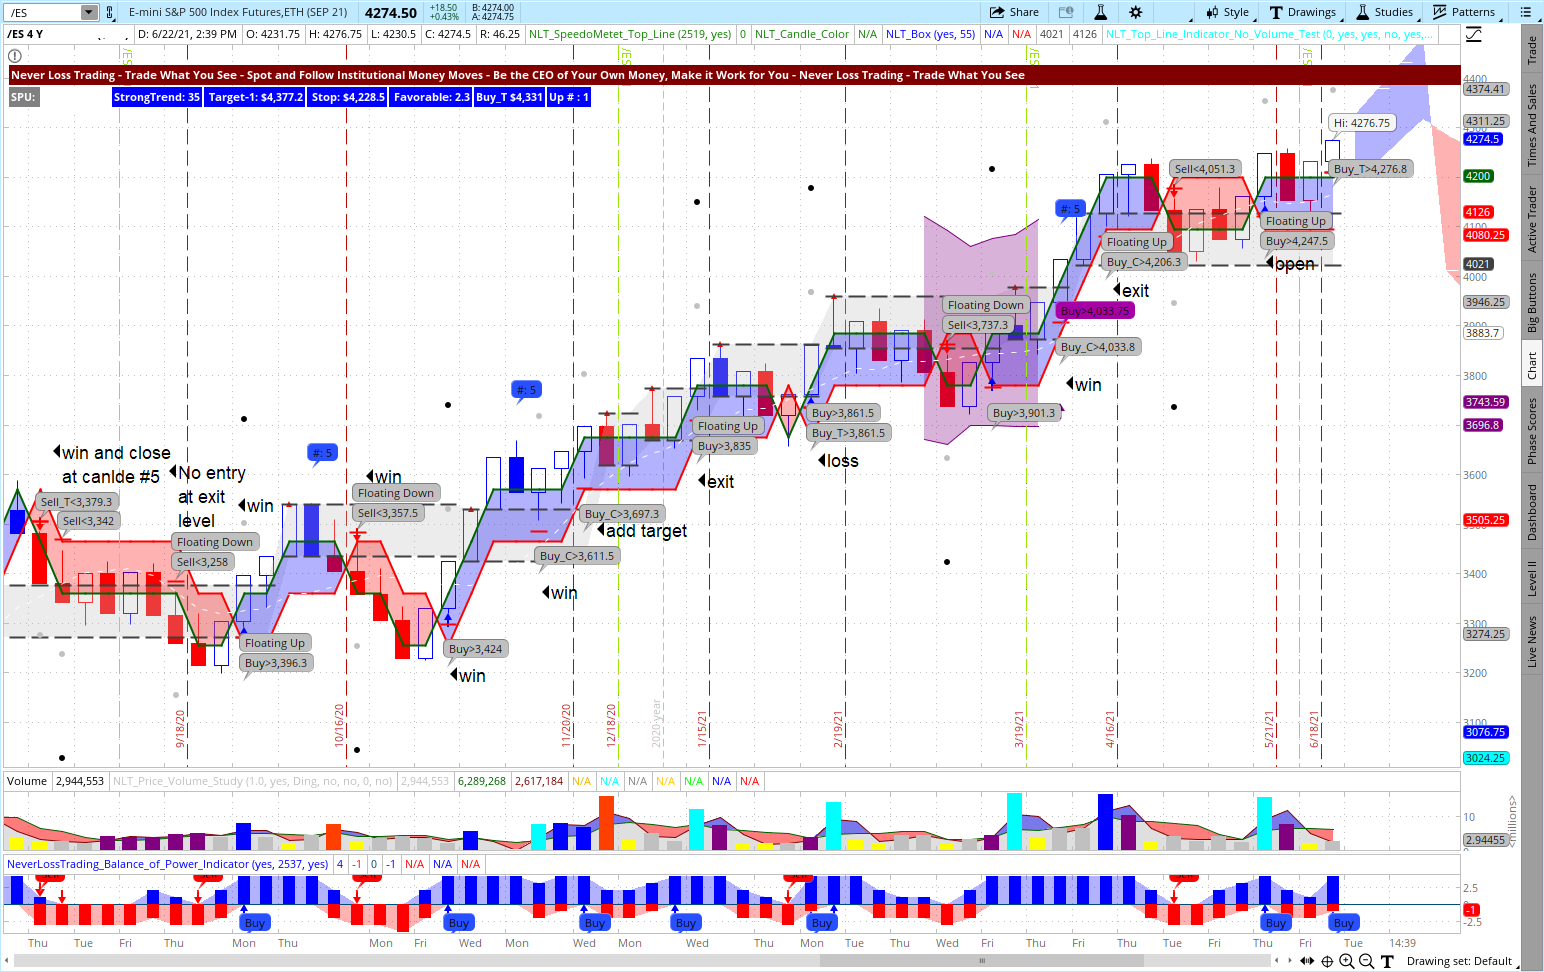
NLT Timeless Swing Trading Example

Timeless Swing Trading Chart by NeverLossTrading

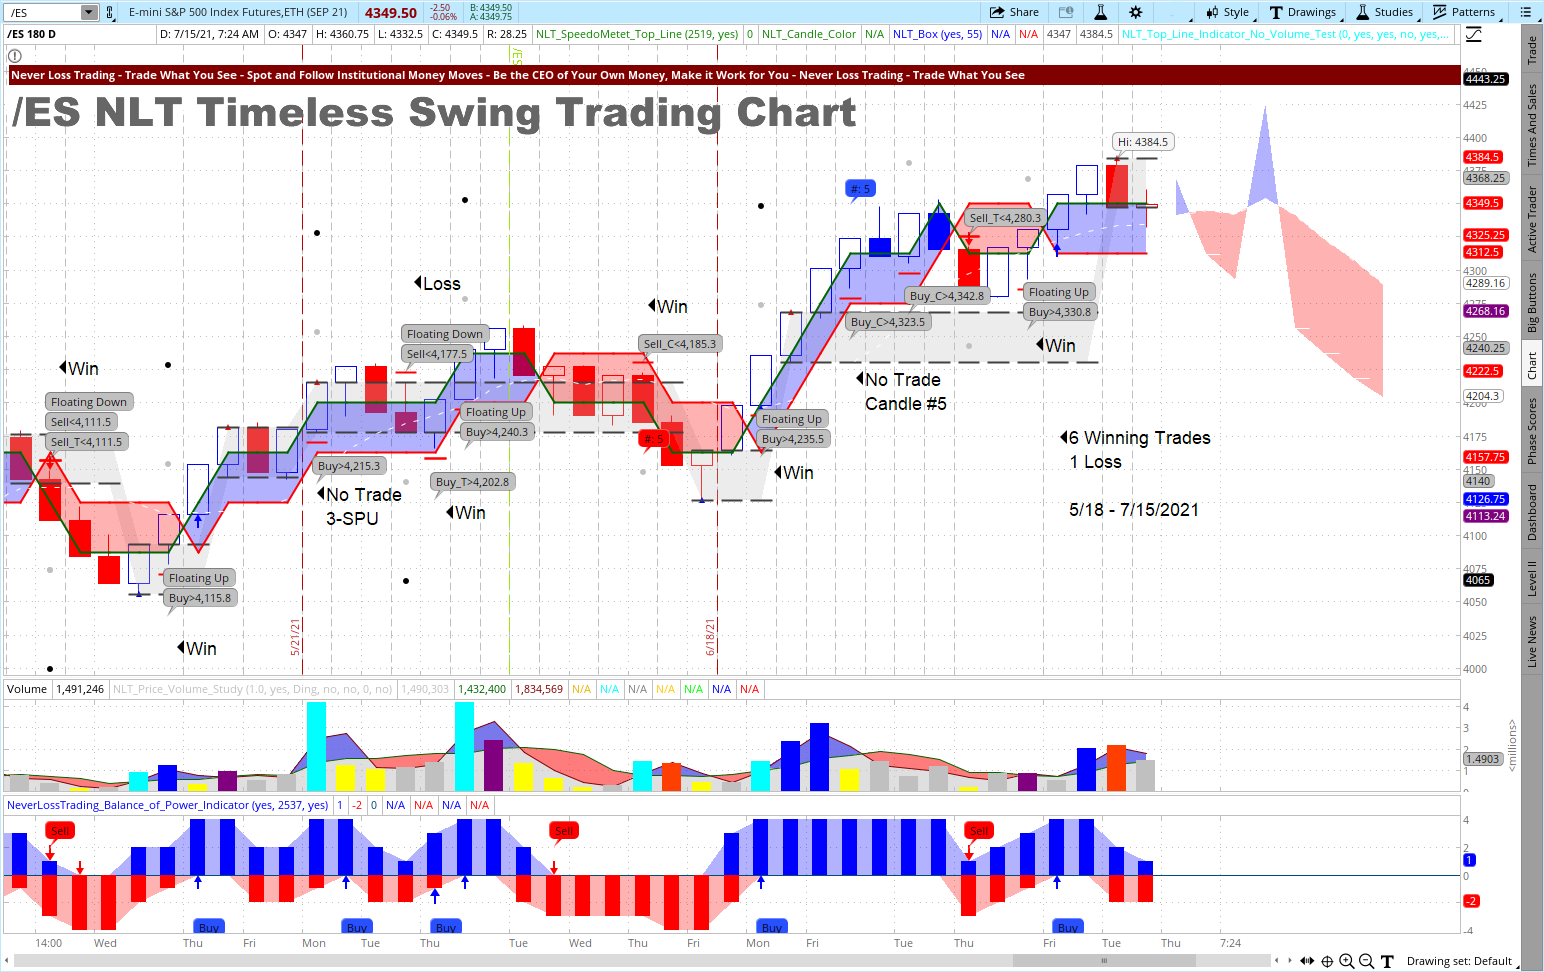
The NLT Timeless Swing trading example shows seven trading opportunities in the observed timeframe of May 8 to July 15, 2021. Six of them came out winners and one loss: definitively high probability.

The average value change of the underlying futures contract in our example was around $2,000. When the associated risk would be outside your risk definition, you could also work with a micro contract, reducing your risk to 10% of the E-Mini contract which trades we share.

There are several rules in making sound trading decisions, and we share those with you in our mentorships. So let me invite you into some:

  • The dot on the chart specifies the target, but you can also read the target from a dashboard on our charts.
  • Stops are indicated by red crossbars.
  • On the chart dashboard, you will also find an indication of where to place your buy-stop or sell-stop order and your trade will only be filled if the price of the underlying reaches the critical price threshold.

NLT Timeless Day Trading Example

Timeless Day Trading Chart by NeverLossTrading

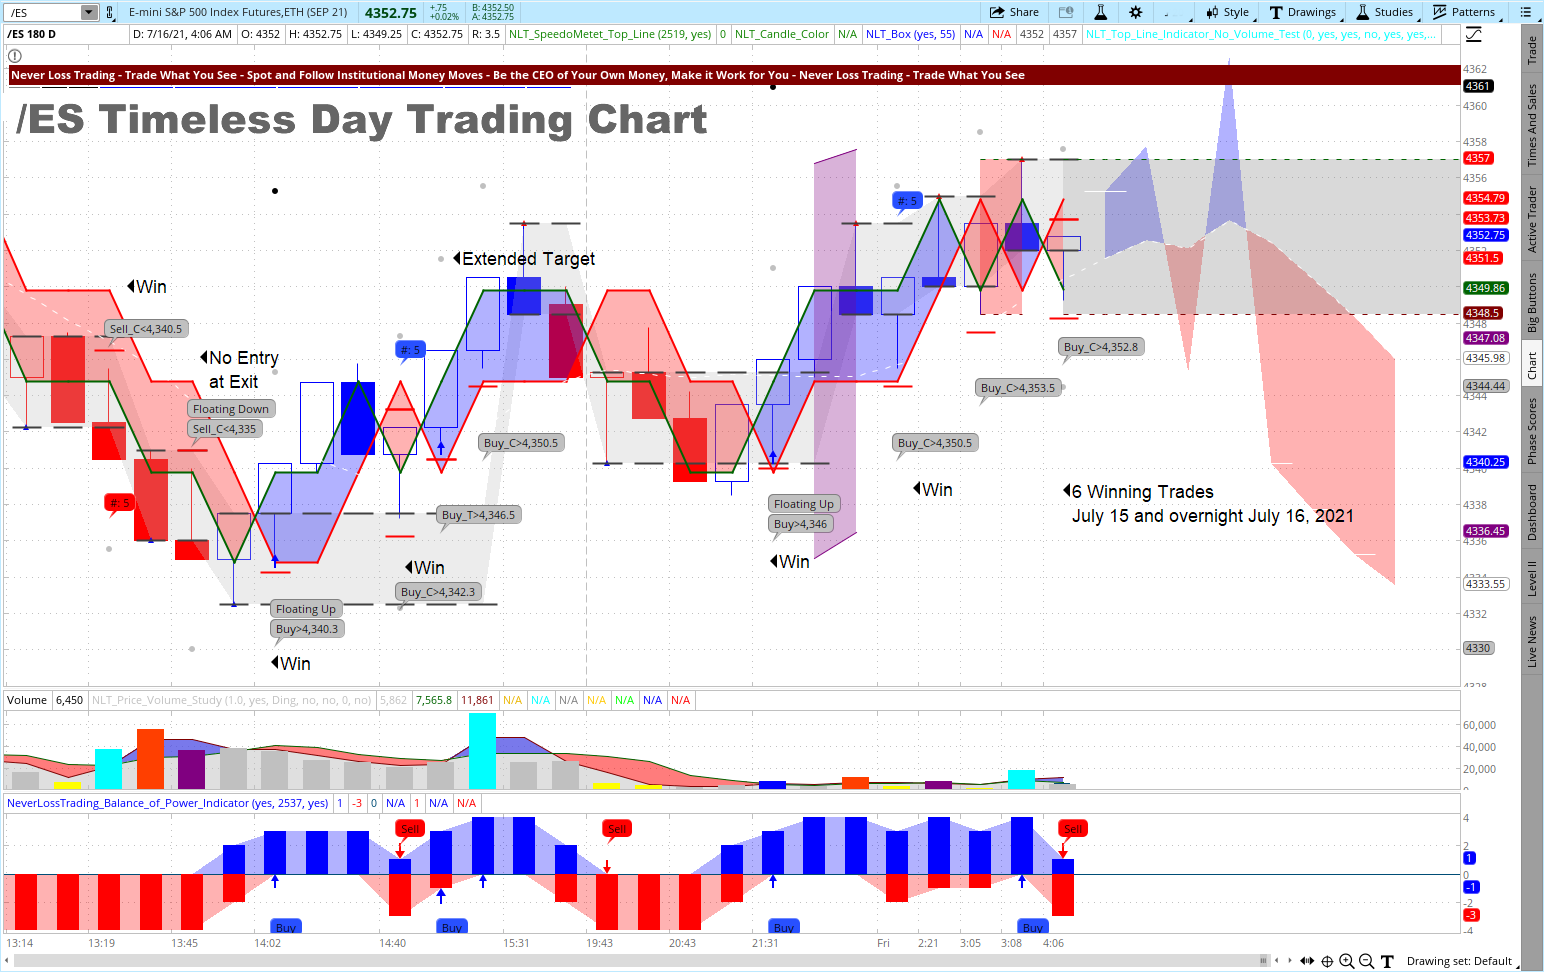
In a 24h period, the system produced six trading opportunities, and when focusing on multiple futures contracts, you can decide from a sound basis for day trading.

NLT Timeless Trading is only one way of putting our systems in action. We work one-on-one with our clients and develop tailored strategies around the use of our systems that fit your circumstances, wants, and needs. To experience how our systems work real-time, schedule an online meeting with us:

contact@NeverLossTrading.com, Subj.: Demonstration.

After a short demonstration of how our systems work, let us continue in calculating the effect of a behavior difference in trading:

Base Behavior Expectation

Do not come to trading with a work attitude. Making money in trading requires an intelligent attitude: Cash in your profits and leave the risk to somebody else!

Base Hypothesis

An average expectation of 5% ROC per week on the full margin allocation is feasible, and we want to calculate the difference between more and less frequent trading.

Calculation Model

Return Expectation

If you reach 5% ROC per week 75% out of 50 trading weeks, this will result in an annual return expectation of 107% ROC. Based on our model, you are looking at $1,500 of income per month when trading one contract.

Return Calculation

To increase the income from trading, you have these choices:

  • Add more capital to the full margin broker account
  • Move to a budget broker account that allows day trading at reduced margins with multiple contracts

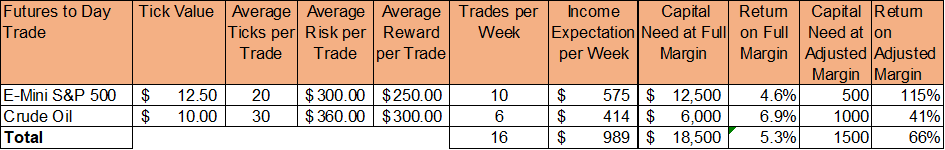
In addition, you can change behavior with a focus on trading less by reaching just one winner per day with the E-Mini S&P 500 contract (four per week) and two winners with Crude Oil Futures per week.

Just spot perfect setups, react, and be good.

Acting like this will increase your earnings expectation by 60%.

Return Expectation

Hence, close the trading day after one winner in each category based on the weekly budget, trading one contract.

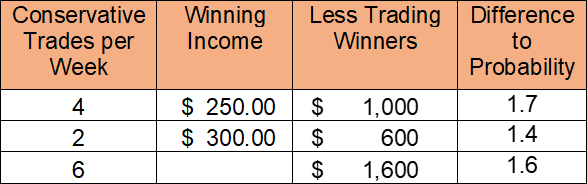
If you get this done 75% of the time and budget a maximum loss of the same amount 25% of the weeks, it will result in a 2.3-times or 230% increased earnings expectation:

Return Calculation by NeverLossTrading

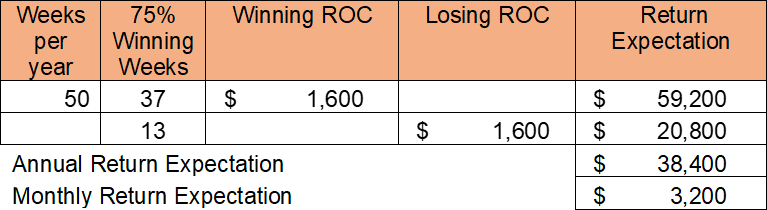
By trading less and with more accuracy, you increase your return expectations, and you still can increase the number of contracts to trade by adding money or moving to a reduced margin broker.

What we shared in our day trading futures example also counts for stock trading, options trading, and FOREX trading.

We are more than 10-years in the trading education business, teaching one-on-one at your best available days and times.

Trading our own account day-by-day and helping clients lets us provide long-term experiences and support.

Customer service and tailored mentorships are our virtue. Following this principle, we provide:

  • Server-installed Software
  • Real-Time Data
  • System-Defined Entries, Exits, and Stops
  • Position-Sizing
  • Time-in-a-Trade
  • Trading-Strategies
  • Risk-Handling
  • Business Plan (financial- and action plan)
  • Own scanners to find investment opportunities
  • Watch list indicators for finding changes in supply and demand on multiple time frames

Basing your trading and investing decisions on defined rules is learnable, and we are here to support you!

Schedule your consulting hour! Working one-on-one spots are extremely limited: Do not miss out!

+1 866 455 4520 or contact@NeverLossTrading.com

With the NeverLossTrading concepts and education, we want to help you de-complex trading decisions and come to high probability trading by solving the challenges with the help of our systems on the spot:

Five Dimensions of Trading and Investing Decisions

Men and women take a considerably different trading approach, and all of us can learn from this to increase our return expectations by following more probable success principles.

Follow our free publications and webinars…sign up here, and we are looking forward to hearing back from you,

Thomas

www.NeverLossTrading.com

Disclaimer, Terms and ConditionsPrivacy | Customer Support

Friday, December 17, 2021

How to know when to Trade?

A quick answer to the question of this publication:

How to know when to Trade?

Your highest likelihood to catch a price movement is when you identify and trade at crucial price turning points!

In this publication, we want to invite you to a method of finding and acting on opportunities where buyers take over from sellers and vice versa.

To share crucial content, we explain how and why, so enjoy reading more than a Twitter message and contact us for questions: contact@NeverLossTrading.com

A price change is the result of a change in supply or demand. Hence, we can predict price development by measuring and extrapolating underlying shifts in supply and demand.

NeverLossTrading Price Turning Point Trades

For specifying crucial price turning points, we use algorithms to put signals or indications of a handover from buyers to sellers and vice versa on the chart for you to trade along with the resulting price movement.

Currently, the longer-term market direction is ambiguous, and we prefer shorter-term trading over longer-term engagement. Hence, day trading and swing trading are in focus.

More than 85% of the orders routed through the exchanges are institutional-based. Thus, the prominent stakeholders’ typical behavior and algorithms define the happening of the markets, and we are assuming crowd behavior: Followers are jumping in the chosen direction of leaders. Thus, our systems ask for confirmed entry price levels. Then, with the help of a price-move-model, a high probable future price move is predicted: By the NLT Speed Unit (SPU), our systems define a future price-point in the natural distribution of prices (following the Markov principle), and when this is reached, we take an exit. The trade orientation is relatively short-term: one to ten bars, and does not follow longer-term price patterns. The trade duration is either defined by a time-based chart or the NLT Timeless Chart, where only price behavior is recorded and builds the basis to predict the future price happening.

The Price Move Model of NeverLossTrading

NeverLossTrading Price Move Model

With our mathematical models expressed in our software, we measure the setup stage of a price move to come and assume prices accumulate before a price move. Our indicators identify this stage by estimating the price-, volume- and volatility development with the NLT-specific market pressure model. In the next phase, prices test the high/low of a price range before the breakout. Alarm settings on the chart indicate when such a situation occurs. Finally, the system notifies you about the price breakout potential, and:

  • It is either confirmed – and we trade along with it.
  • Or it is not confirmed – and we stay out of the trade.

With NeverLossTrading, we built a natural behavior model, which considers repetitive action in the behavior of leaders and “crowd behavior”: The crowd is following the leaders. Then, we translated this into a trading plan with our mathematical models, which gives us defined entries, exits, stops, or price adjustment levels.

Let us share some examples:

  1. Stock Trading Examples

Soon, we will be writing the year 2022, where home computers and servers are powerful to process vast amounts of data in real-time. Such, you do not have to screen through hundreds of charts; with the suitable instruments on hand, you can shorten your fairway to trading success.

Here is an example of a simple dashboard relating the expected price move with a reward/risk concept:

NeverLossTrading Dashboard

Let us jointly read left to right:

  • SPU in gray identifies that the price move is average; cyan indicates excessive and orange rising price momentum.
  • $7.67 is the expected price move of the underlying stock, and 2.5 identifies the return on cash of a $7.67 price move.
  • Trend 25 in blue identifies a slight uptrend, and when you trade this situation, take profit when the stock price reaches $318.02 and place a stop or price adjustment action at $304.14.
  • When you trade like this, you expect for every dollar of risk a $1.30 of a return.

Simple and easy to read, now you see it magnified on the AAPL price chart:

Daily AAPL NLT Top-Line Chart Example

NeverLossTrading Top-Line Chart on AAPL

Now you understand how modern computer technology can help you as a trader to take meaningful decisions right from the chart: You trade what you see!

It is your system’s duty, help you find underlying changes in supply and demand, paint those on your charts, and give you market scanners that let you find those opportunities without the need for going through hundreds of charts. Our systems work on all time frames: Another example of AAPL on a monthly chart.

AAPL Monthly NLT Top-Line Chart

AAPL on the NeverLossTrading Top-Line Chart

You see five highlighted situations that we analyze in detail for you.

SituationActions
Situation-1Long trade by the price threshold: Buy > $190.37, being surpassed in the next candle. Trade for a maximum of five bars or to the price target. The trade started in an NLT Light Tower and ended there (candle with the cyan dot).
Situation-2No trade. The signal/direction is not supported by the lower study.
Situation-3Long trade for a maximum of five bars or exit at the NLT Box Line.
Situation-4Long trade for a maximum of five bars.
Situation-5Short trade to target.
Trade Situations Explained

Our brand name derives from the concept of repairing a trade instead of accepting a stop loss; however, Never Stop Loss Trading was a bit lengthy.

TradeColors.com is our introductory system to high probability trading. We always allow for upgrades; you only pay the difference if you start with TradeColors.com and upgrade after.

TradeColors.com works by specifying potential trade situations by a two-candle color code: two of a kind and the high of two blue candles or the low of two red candles surpassed in the price movement of the next candle leads to a trade.

Let us share an example:

IWM on a Six Month Daily TradeColors.com Chart

IWM on the TradeColors.com chart with SPU Move Indicator

The chart highlighted in orange trade situations confirmed by the next candle’s price move. In total, by following the system mechanically, eleven winning and two losing trades were achieved in six months.

From a return on investment perspective, you were looking at about 2.5% return on cash per instance with the same risk amount. This would have totaled up to 11 x 2.5% – 2 x 2.5% = 22.5% return in six month, not considering compounding interest. When we are not compounding interest

We included a new bottom indicator on the above chart and offer it as a year-end special for new subscribers.

Many of our clients purchase more than one system: Our systems are productivity tools, and by combining them, you produce a higher participation rate and higher returns.

NLT System Index Productivity Comparison
NeverLossTrading Systems on a Productivity Index

After demonstrating some swing- and longer-term trading examples on stocks, let us lead to Futures trading.

  • Futures Trading Examples

If you are not considering futures trading by today, let us quickly give you in a short overview the advantages futures trading can provide you:

Advantages of Futures Trading

We hope this simple graphic explains why futures trading is essential as an investment vehicle. However, there is another dimension to it: You can protect your assets using futures contracts for overnight hedging, and we explain all this and more in our mentorships.

The E-Mini S&P 500 Contract is a forerunner of the S&P 500 index and trades around the clock six days a week. It is a leveraged product, and you only have to bring up a fraction of the margin to participate and trade the index. Let us show you a recent daily chart:

ES, NLT Daily Trend Catching Chart, Oct/Nov. 2021

NLT Trend Catching Chart with SPU Move Indicator

From left to right:

  • Sell < $4317.3, not confirmed in the price movement of the next candle, no trade.
  • Floating Up, Buy > $4437.3, confirmed and came to target three candles after. By not entering at an exit candle, we neglect Buy C > $4517.5.
  • Re-Entry at Floating Up, Buy C > $4543.3. Target reached three candles in the trade.
  • Re-Entry at Floating Up, Buy C > $4603.5. Target reached after three candles in the trade.
  • All other signals were not confirmed, and it is vital to stay out of a trade when no direction price pressure carries the trade to target. Therefore, we aim to produce income or a return, not to trade the trade.

Combining NLT Timeless and Time-Based signals increases your participation rate and investment opportunity for returns.

With the help of our systems, we help retail traders to decide at trade entry for five significant challenges to prevent the common mistakes:  

  • Trade entry decisions (when to trade)
  • Exit decisions (where to take profit)
  • Stops (where to place them)
  • Maximum time in a trade (specified by the signal)
  • Risk to reward (only trade at favorable setups)
Five Dimensions of Trading Decisions

With the NLT Timeless Concept, we introduced a new way of trading in 2021, and it can change your life as a trader, giving you unique entry and exit points, hard to predict for other market participants. We dissect time-based moves into price-based happenings with the NLT Timeless concept. Let me share a chart example:

E-Mini S&P 500 Futures Contract on December 1, 2021

NLT Trend Catching Chart

The chart shows multiple trading opportunities, and you decide on those by rules we share with you in the mentorship. Those rules help you separate good from risky trades and provide one basis for our high probability setups. Let me give you an example:

In a short environment, the first leg wrong is wrong!

Explanation: When asset prices are dropping, you do not want to focus on a v-shape recovery; hence, you do not trade the first leg up, assuming it is just short-covering; however, you will trade the second leg up and act the same way on rising prices. Combining this pattern view with the indications you see on the chart paves your way to finding and working on high probability setups.

In the chart above, we shared nine winning trades, had you did not consider not trading the first leg, the trading day would have ended in nine winning (75%) and three losing trades (25%).

With the help of the NLT Timeless Concept, we cut the daily development into managerial portions with limited risk and defined expectations. Here is the referring daily chart:

E-Mini S&P 500 Futures Contract, October 15 to December 1, 2021

NLT Trend Catching Chart

The chart includes our latest development: the NLT SPU Move Indicator, which is an addition to the NLT Systems. It works as a standalone and in conjunction with other NLT systems. As a year-end special, we offer to include this indicator for free if you sign up with us in 2021: a $3,997 value.

Experience how our systems work in a consulting hour:

contact@NeverLossTrading.com  Subj.: Demo.

We are happy to hear back from you!

www.NeverLossTrading.com

Disclaimer, Terms and ConditionsPrivacy | Customer Support

Saturday, December 11, 2021

How to Trade into and during 2022

Experience the best appropriate strategies that fit today’s market environment in a 45-minute video with multiple examples. 

Click here to watch the video.

This video is part of a four-speaker event hosted by InvestorExpos on December 2, 2021.

We are happy of helping you to find which of our systems and mentorships suit you best:

contact@NeverLossTrading.com  Subj.: Demo.

Good trading,

Thomas

www.NeverLossTrading.com

Disclaimer, Terms and ConditionsPrivacy | Customer Support