Within the dynamic landscape of financial markets, pursuing profitable trading strategies is an ongoing commitment for investors endeavoring to navigate the intricacies of asset management. The maxim “Intelligent Traders Trade Intelligently” encapsulates the core principle of strategic trading, highlighting the criticality of employing sophisticated methodologies and resources to attain enduring success in the market. However, if the intelligence quotient alone guaranteed wealth within the market, a significantly more significant number of traders would find success. Therefore, our focus remains steadfast on adopting a learnable systematic approach centered on replicable price setups and investment strategies.

NeverLossTrading is not a vow of infallibility in trading; instead, it embodies the art of seizing high-probability price turning points, aiming for consistent income by skillfully averting drawdowns. At the forefront of this ethos is NeverLossTrading, a pioneering platform that empowers traders with cutting-edge technology and comprehensive resources to optimize their trading endeavors. By blending the art of intelligent trading with the innovative solutions offered by NeverLossTrading, investors can unlock a wealth of advantages and propel their financial aspirations to new heights, where we focus on specific actions and strategies for:
- Day Trading (open and closing positions the same day)
- Swing Trading (holding open positions for multiple days)
- Longer-Term Trading (holding positions for multiple weeks)
In the realm of swing trading and longer-term investing, the NLT trade repair method introduces a strategic dimension to high-probability trade setups, yielding a significant impact.
One of the key advantages of adopting NLT methodology is the emphasis on data-driven decision-making. In today’s fast-paced markets, where volatility and uncertainty abound, having access to real-time market analysis and actionable insights is paramount. Through sophisticated algorithms and advanced analytical tools, NeverLossTrading equips traders with the ability to identify lucrative trading opportunities with precision and confidence.
How to let the chart tell when to buy or sell:
- System-defined price thresholds for entry: Buy > or Sell below a certain point when the system assumes that other market participants think and act the same.
- The target price is defined at entry before a potential for an opposite price move is expected.
- Stop or price adjustment level that considers a system adequate risk/reward ratio to trade with the odds in your favor. NeverLossTrading’s approach is rooted in risk management principles, mitigating the inherent uncertainties associated with trading. By employing proprietary risk assessment techniques and implementing robust stop-loss or trade adjustment mechanisms, traders can safeguard their capital and minimize potential losses, thereby fostering a more sustainable and resilient trading portfolio.
We best share some examples of how this works in different trade environments:
Day Trading
People prefer day trading for its potential quick profits from short-term market fluctuations – avoiding overnight risks, all positions will be closed at the end of the trading day.
One of our day trading concepts is to aim for a consecutive weekly income goal and stop trading when attained – participating in one or two trades per day.
You will learn high-probability chart setups by combining time-based happenings with NLT Timeless charts and act less frequently for higher average income. The concept works for all asset classes, and we choose futures trading to share the principle.
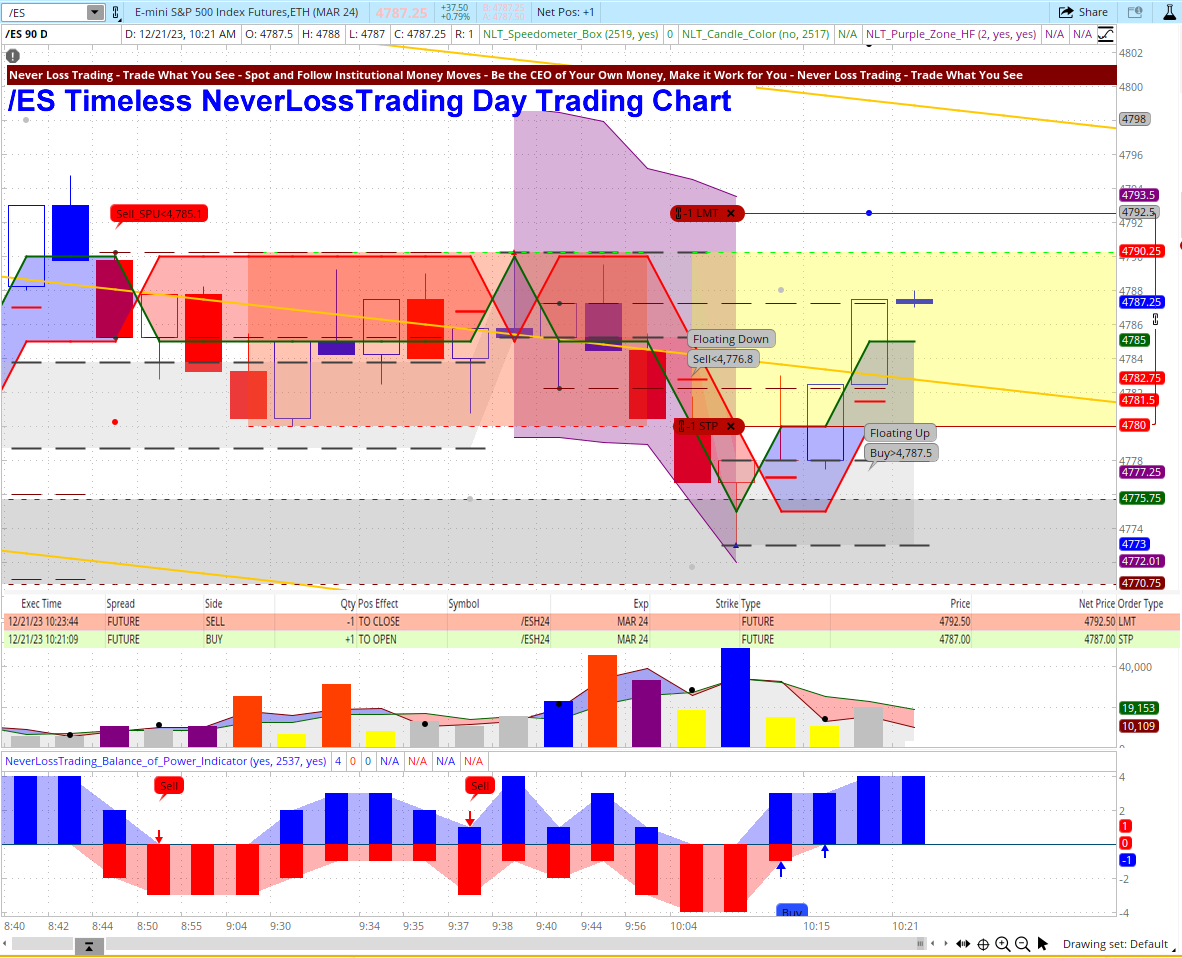
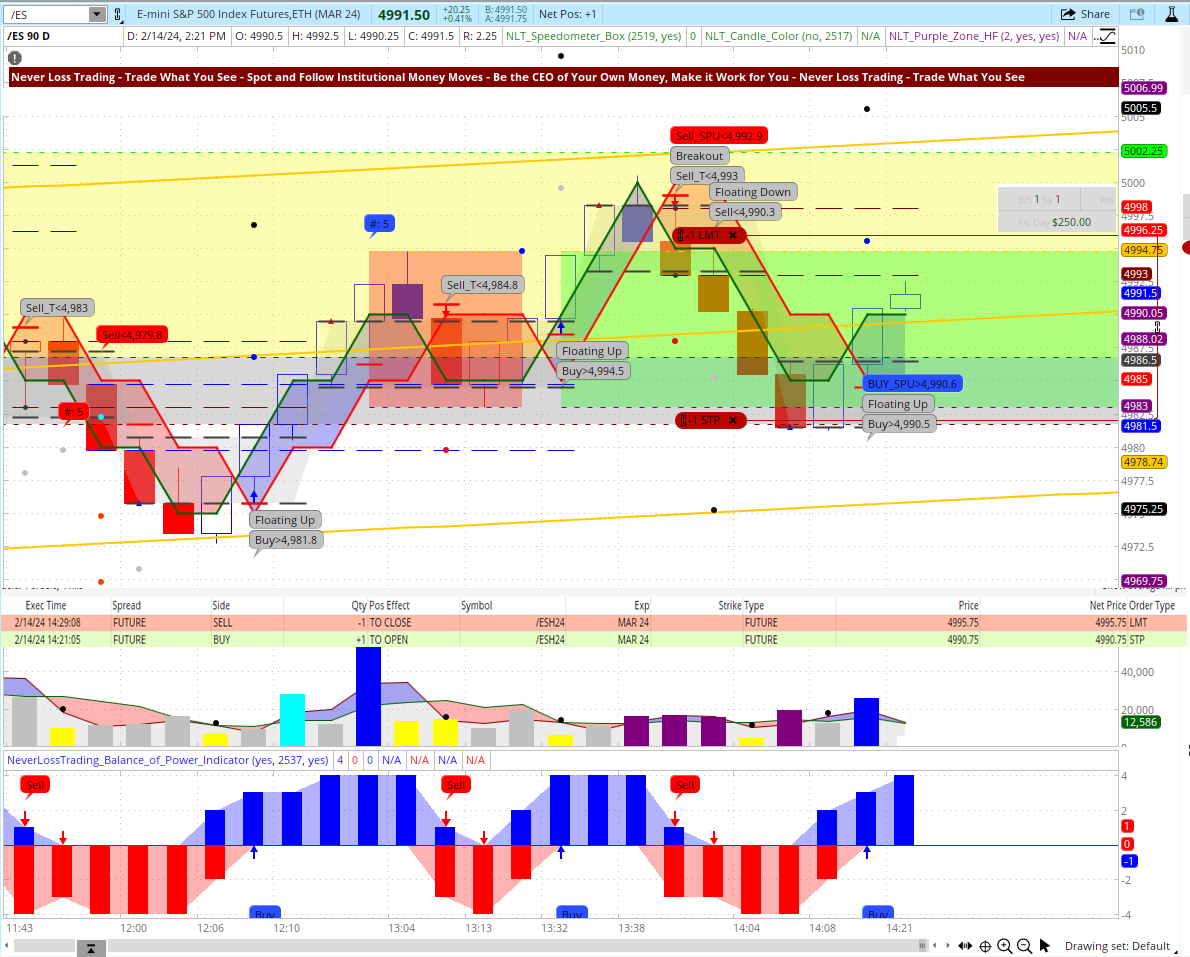
At 14:21 ET on February 14, we initiated a long trading position with the /ES (E-Mini S&P 500 futures contract). This decision was prompted by a buy signal indicating that the price had surpassed the Buy > $4,999.50 threshold, supported by floating indicating a breakout from a containment area with upward pressure. The trade reached its target at 14:21, as indicated by the dot on the chart, while the red crossbar denotes the system’s predetermined stop level. With one futures contract traded, we realized a profit of $250. While there were previous signals leading to targets, we focus on this specific instance for discussion purposes.
Operating our systems and interpreting charts effectively requires adhering to specific rules that are comprehensible through learning and practice.
E-Mini S&P 500 Futures Trade February 14, 2024
Swing Trading
Swing trading appeals to those seeking to capitalize on intermediate-term price movements, often holding a position for a few days rather than weeks.
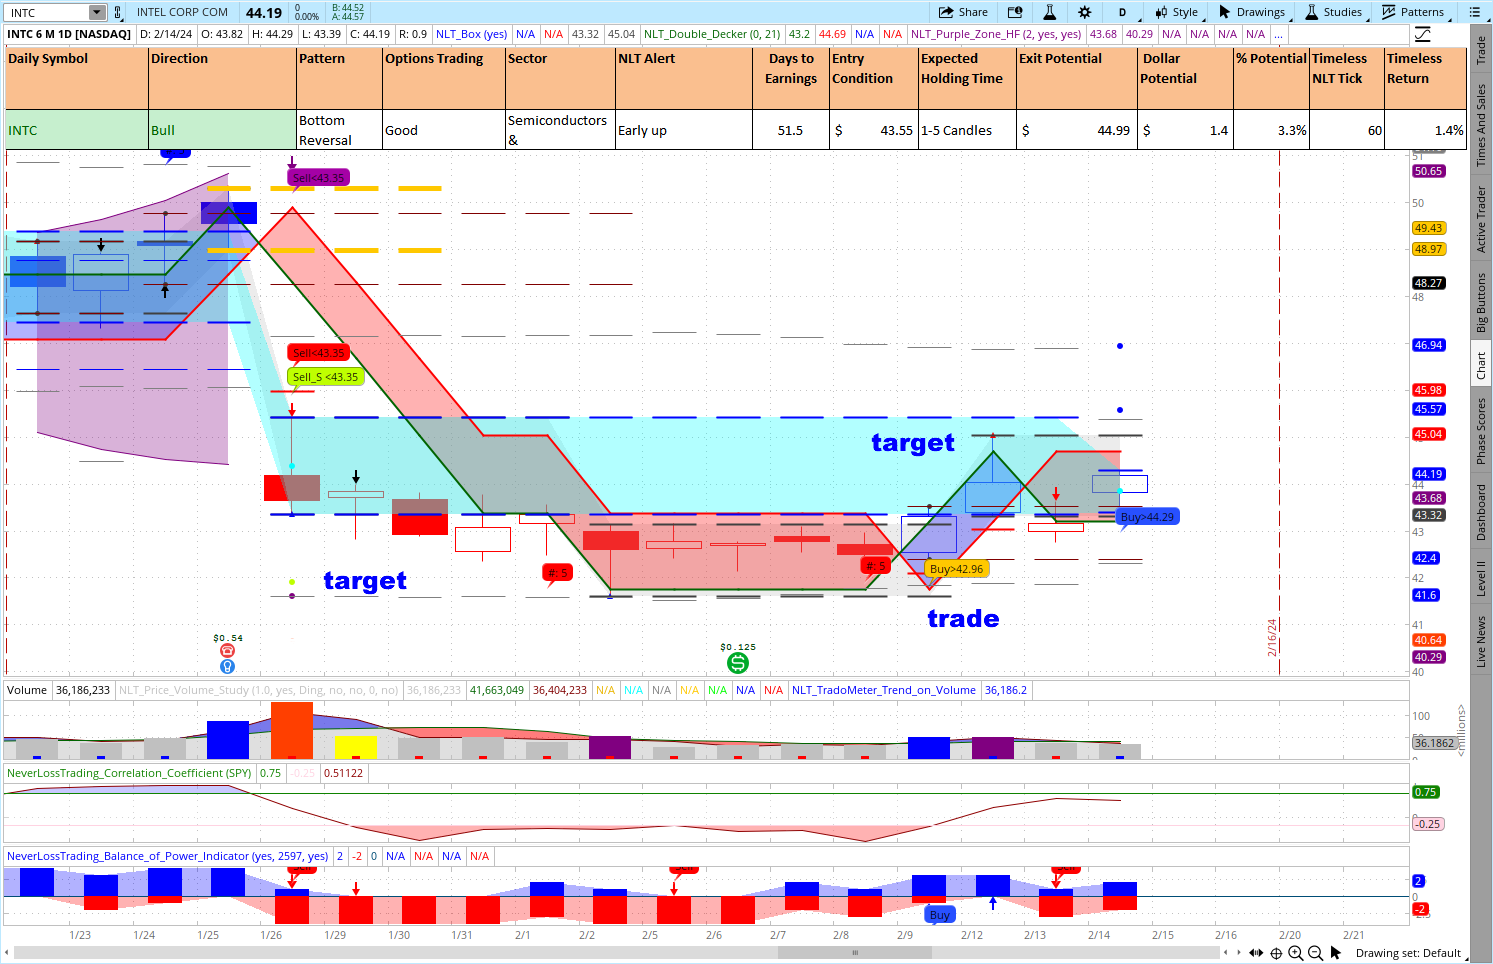
Intel (INTC) is a very recent example. For February 12, our NLT Alerts indicated for intel a buy signal (orange signal on the chart from February 9, 2024). The threshold to enter the trade was $43.55, with a target of $49.99, trading for a 3.3% return on cash.
INTC, NLT Swing Trading Chart

Hence, a buy-stop order with a bracket was set pre-market, filled and reached its target. In this case, all in one day. When looking to the left, on January 29, a short trading opportunity was confirmed and came to target on February 2, 2029.
We could undoubtedly add trade over trade, but I wanted to pick some recent examples to demonstrate how our system paints trading opportunities on the chart and how to implement them.
Longer-term investing is favored for its potential for sustained growth and the ability to ride out market volatility, aiming for wealth accumulation over time.
Long-Term Investing
We take longer-term trading decisions from weekly charts and pick Microsoft (MSFT) to demonstrate how to put signals in action.
MSFT Long-Term Investing
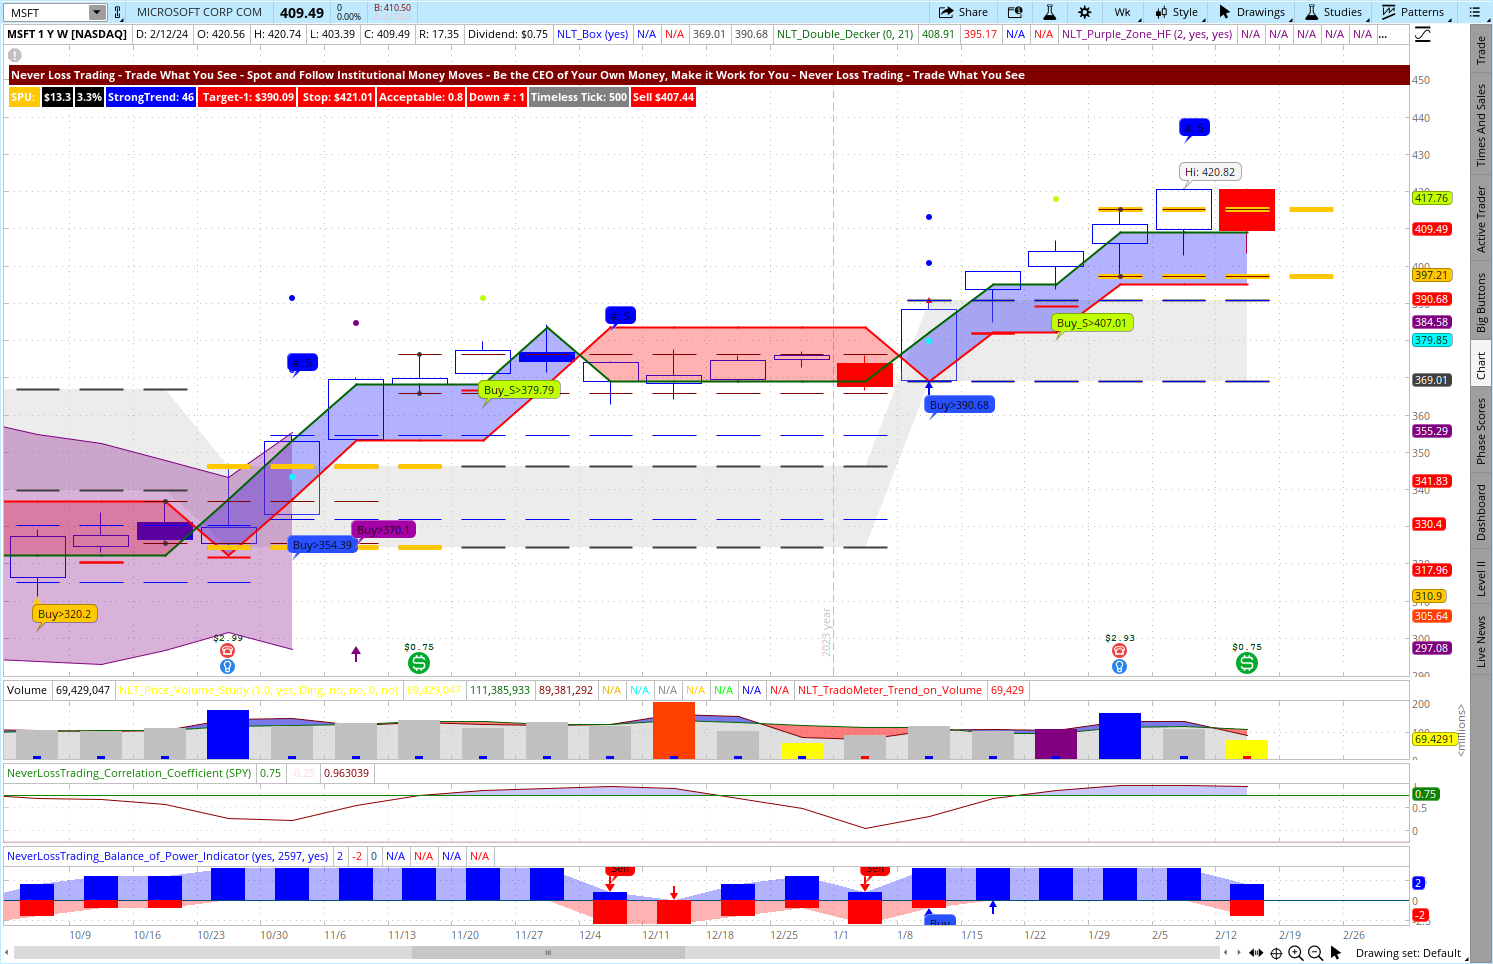
From left to right:
After an NLT purple zone occurs, we do not open trades as long as such a zone is present. NLT Top-Line Charts paint upward momentum in blue and downward momentum in red; when red and blue mix, purple indicates no directional price pressure.
Then you see multiple buy signals along the blue upward framed price move that all came to target (dot on the chart). The actual candle does not possess a signal. With the help of this chart, you decide once a week what you do, and you pre-program entries, exits, and stops.
NeverLossTrading offers a comprehensive suite of educational resources and personalized coaching services, enabling traders to continuously enhance their skills and refine their strategies. From interactive workshops and live trading sessions to one-on-one mentorship programs, NeverLossTrading empowers traders of all experience levels to stay ahead of the curve and adapt to evolving market conditions effectively.
In addition to its advanced technology and educational offerings, NeverLossTrading distinguishes itself through its unwavering commitment to transparency and integrity. With a steadfast dedication to ethical trading practices and client-centric values, NeverLossTrading fosters a culture of trust and accountability, ensuring that traders can trade with confidence and peace of mind. We equip traders with practical tools and methodologies to identify high-probability trade setups, helping them make informed decisions based on market trends and price action.
Subscribe to receive our trading tips.
Executing trades at the right time can be challenging, especially in fast-moving markets. NeverLossTrading offers techniques for precise trade entries and exits, allowing traders to capture optimal returns. With its focus on high-probability setups and systematic approach, NeverLossTrading helps traders improve their trade execution and timing, maximizing their profit potential.
We have a special offer for you: ask for our 2024 startup.
The financial markets are dynamic and ever-evolving, requiring traders to stay updated and continuously learn. NeverLossTrading promotes a culture of continuous learning, providing educational resources, webinars, and personalized mentoring. Traders gain access to a wealth of knowledge and expertise, empowering them to adapt to changing market conditions and enhance their trading skills.
To succeed in trading, you best work with an experienced coach. Our #1 competitive advantage is the support and customer service we offer. Veteran traders have been through more ups and downs than you can imagine. So, experienced pros have probably experienced whatever you’re going through. Suppose you are ready to make a difference in your trading. We are happy to share our experiences and help you build your trading business. Trading is not a typical career, and you best learn from those who are long-term in this business to cope with the rollercoaster of the financial markets. We are here to help and provide feedback on what you might be doing right or wrong. Strive for improved trading results, and we will determine which of our systems suits you best. The markets changed, and if you do not change your trading strategies with them, it can be a very costly undertaking. Hence, take trading seriously, build the skills, and acquire the tools needed. Trading success has a structure you can learn and follow.
contact@NeverLossTrading.com Subj. Demo, and we will find out which system package suits you best.
In conclusion, the mantra “Intelligent Traders Trade Intelligent” serves as a guiding principle for traders seeking to thrive in today’s competitive markets. By harnessing the power of innovative solutions and strategic insights offered by NeverLossTrading, investors can unlock the full potential of their trading endeavors and embark on a path toward sustained success and financial prosperity. Whether you’re a seasoned trader or just starting, NeverLossTrading offers the tools, support, and expertise you need to elevate your trading game and achieve your goals.
Good trading,
Thomas Barmann (inventor and founder of NeverLossTrading)
Disclaimer, Terms and Conditions, Privacy | Customer Support