Spot and Trade Institutional Money Moves

Algorithmic Trading with Human Interaction for:

Day Traders, Swing Traders, Long-Term Investors

Thursday, November 11, 2021

Why and How to Trade the Earnings Season?

 Summary: Stocks experience strong price moves when publicly-traded companies deliver their quarterly earnings reports. We share a systematic approach, how you can spot and participate in those opportunities as a retail trader.

Read on, watch the video or listen to our PodCast.  

NeverLossTrading Earnings Call Feature
  1. Introduction

At NeverLossTrading, we start to look about 20-trading-days (four weeks) in advance to the earnings call for price move indications and act on them. Here is an example for NVDA:

NVDA, NLT Weekly Top-Line Chart, Sept. – Nov. 2021

NVDA on the NLT Top-Line Chart

The chart indicated Buy > $257.09, and we only act if this price threshold is surpassed in the price movement of the next candle, which was the fact. The system also indicated an expected price move of 2-SPU, reaching $295.50 (achieved). After that, the stock price went even higher and then fell back to the stated level.

Typically, we do not want to open or hold speculative positions two days before earnings and the day after.

The reason for this:

  • High volatility and an unreasonable risk that stops getting triggered.
  • Market-plays by big money flooding or shortening supply and triggering strategic price moves, which bare an unbalanced risk for the trader or investor

What to do if you hold a long-term position?

You work with a form of protection by adding options to the stock for not carrying a risk outside a set risk tolerance: no more than 5% risk per position.

SBUX, NLT Top-Line October/November 2021

SBUX on the NeverLossTrading Top-Line Chart

The chart shows, we had two NLT Top-Line signals indicating buy opportunities when the price threshold was surpassed in the price movement of the next candle: This was the fact, and the system displayed a price target of $115, with entry at $110.15, a 4.4% return on cash when buying the stock and multifold when trading with an options strategy. This NLT signal also indicated that the target price should be reached in a maximum of five days, which was the fact.

As a trader or investor, always consider: you are making an assumption about the future outcome of a trade, but you are only in control of the risk by applying risk-limiting strategies.

All of this is learnable, and we are here to help in a one-on-one session, transferring the appropriate indications, strategies and risk-liming actions: Skills, rarely to be found but learnable.

If you want to see how our systems work life, schedule a consulting hour: contact@NeverLossTrading.com Subj: Demo.

2. Content of Earnings Reports

Earnings reports contain a variety of financial information on the corporate quarterly business’s performance, including:

  • Balance Sheet
  • Income Statement
  • Cash Flow Statement
  • Market and Sector Performance

When a quarter ends, public companies start to report their actuals and business outlook. Companies with a significant impact on their actuals and outlook are what the market spots for.

NeverLossTrading Top-Line includes what we call the NLT Seasonal Projection Study, which indicates if stocks have a usual pattern of usually dropping into earnings and potentially coming out strong. Sure, history does not need to repeat itself, but when institutional investors consider a particular pattern, you better be aware of it.

Here is an example of IBM, which had a pattern of weakness into and out of October earnings:

IBM, NLT Seasonal Projection, September – December 2021

IBM on the NeverLossTrading Seasonal Projection Study

The red arrows on the chart identify expected price drops of ≥ 5% in a matter of 10 days. In the actual situation, IBM dropped close to 17% and offered an excellent opportunity to participate in its seasonal pattern for those who knew it.

Does a stock always follow this pattern?

No, but we found a high likelihood in it, and such it adds to other of our indications, helping traders spot substantial price move opportunities.

3. Start of the Earnings Season

We are just concluding an earnings season; as a rule of thumb, the reports of critical financial institutions, about two weeks after the end of the quarter starts the season: JP Morgan (JPM), Morgan Stanley (MS), Goldman Sachs (GS), Bank of America (BAC). Aside from declaring their actual quarterly achievements, those companies forecast other company’s performance ​based on in-depth research and give expectation value for:

  • Earnings per share
  • Sales
  • Profit margins
  • Unit sales

These forecasts are considered in estimates by financial news organizations like Reuters and Bloomberg. At times, the numbers differ slightly, but they are generally very close.

The hype of earnings declarations comes about four weeks into the earnings season, when AAPL and AMZN report and give a core outlook for the sector. At the peak, over 150 companies report earnings in a single day, offering you plenty of opportunities to participate in trades in and out of earnings with a solid system indication on hand.

4. Price Move Indications

In the NeverLossTrading Alerts, we highlight the days to the earnings announcement on all listed stocks, so you know if you trade with an additional risk or opportunity. But you also find indications for the earnings release on our charts to see the day, time, and expectations of the earnings release, and we teach the details in our mentorships.

You can also find a company’s earnings date on a variety of websites. We generally recommend Yahoo Finance.  

NLT Stock Alert Example for November 5, 2021

NLT Stock Alert for November 5, 2021

The NLT Alert reports on multiple levels are helping you to put those opportunities in action with conditional buy-stop or sell-stop orders. For example, the alert for November 5 showed two short trades: NFLX and BK. In the price continuation of the next day, only NFLX surpassed its price threshold and led to a trade.

NFLX with NLT Top-Line Signal for November 5, 2021

NFLX with the NLT Top-Line Signal

The impact of earnings on a stock price is not an exact science. Here is a small selection of the factors that can impact a stock’s reaction to earnings:

  • Earnings per share (relative to expectations)
  • Sales (relative to expectations)
  • Profit margins (relative to expectations)
  • Product unit sales (relative to expectations)
  • The company’s future outlook (relative to expectations)
  • Comments made by executives on the conference call
  • How much the stock is up or down before earnings

“Prediction is challenging, especially if it’s about the future;” hence, it is not uncommon for a company to beat expectations and share prices fall or report terrible earnings, and we see its stock rise.

Why does that happen?

It’s all about expectations, the appraisal, and the action of institutional money: This is why our indicators spot and follow institutional money flow to indicate with a high probability where the price move is most likely going to start and end.

Hence, we let the market and institutions appraise the stocks price journey and latch on, entering and exiting positions faster than institutions can. Here is the price move model we follow:

5. NeverLossTrading Price Move Model

NeverLossTrading Price Move Model

Theory: Key asset holders will have a solid need to re-balance their inventories. Thus, at a particular price expansion, they will either float- or shorten supply, which will result in an opposite directional price move that will then take away from our profits. Knowing this, we pre-calculate how far the expected price move will reach, and there we take profit,  assuming it will retrace or reverse after.

Our brand name derives from the concept of repairing a trade instead of accepting a stop loss; however, Never Stop Loss Trading was a bit lengthy.

TradeColors.com is our introductory system to high probability trading. We always allow for upgrades; you only pay the difference if you start with TradeColors.com and upgrade after.

Many of our clients buy more than one system: Our systems are productivity tools, and by combining them, you produce a higher participation rate and higher returns.
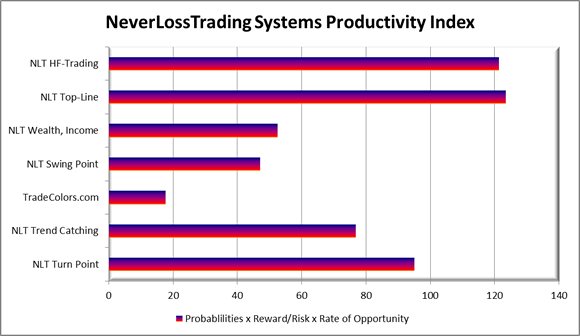
NLT System Index Productivity Comparison

6. Exit Strategy

Our tool to calculate the expected price move is the SPU = Speed Unit, and it indicates how far a price move shall reach until it comes to an end. 

With our systems, you can operate with conditional buy-stop and sell-stop OCO orders (one-cancels-the-other). Without the need to be in front of your computer for the orders to execute. You are entering by price thresholds, ensuring that other market participants have the same directional assumption as you do and exit at the SPU target or adjust the trade at the stop.

NeverLossTrading SPU Move Model

By a change in the frequency and amplitude of the price movement over time, we specify indications to act on high probability price turning points, applying mechanical rules rather than leaving room for interpretation.

7. Earnings Strategies

Instead of buying the stock, a risk-limiting strategy traders apply is buying Call or Put options ahead of earnings reports in the hopes of catching a big move up or down.

However, there is a problem with this approach.

Options are costly ahead of earnings, which makes it difficult to get a good return on them.

When we scroll back to the NLT Alert, you see that we list fair prices for options, so you are always aware of options being reasonable priced or overpriced.

NLT Alert for November 5, 2021

NLT Stock Alert for November 5, 2021

The last columns show what a fair option price is, and such you are always in the position to decide if Put or Call options are a good investment instrument.

Vega, a measure of the implied volatility, needs to be considered, which is usually extremely high ahead of earnings and collapses after. In our mentorship, we share alternative ways to work around this issue and still limit your risk of a trade in- and out of earnings.

There is always a way to participate in a trade, and it is learnable.

The current earnings season is ticking off the calendar, but the next one is coming up in January 2022 and if you want to be ready, contact us for a demo and consulting hour:

contact@NeverLossTrading.com  Subj. Demo

Earnings trades are only one of the strategies we teach, and we are happy to get together with you and find out which of our systems best suits your wants and needs, helping you to solve five major dimensions of trading, where many mistakes can be made:

  • Trade entry decisions
  • Exit decisions
  • Stops (where to place them)
  • Maximum time in a trade
  • Risk to reward
NeverLossTrading Dimensions of Decision Making

In addition: we are offering a year-end special you do not want to miss out on.

We are happy to hear back from you.

Thomas Barmann (inventor and founder of NeverLossTrading)

www.NeverLossTrading.com

Disclaimer, Terms and Conditions, Privacy | Customer Support

Tuesday, November 2, 2021

Trading Psychology and Systems

 If trading was easy, nobody would ever go to work; however, it is learnable – it needs time, a solid system, and a coaching program to beat the financial pros.

Listen to our Podcast and read the article to experience what is needed for producing trading success in 2022 and forward.

Retail Traders and Institutional Investors

With the help of their system, traders make a best-guess prediction about what is most likely happening and take action by sending orders to the markets.

Trading is a challenge for your mind:

  • You are dealing with constant probability and risks outside of what other professions require.
  • You are working with a high level of ambiguity. Your brain translates this into uncertainty and relates to a negative stimulus of fear.

Unfortunately, the brain has a negative bias in its predictions, which is part of human survival. As a trader, constantly doubting your decisions is a path of producing a chain of doom: small win, small win, significant losses. Thus, conscious and sub-conscious decisions making chains are triggered and work against each other.

The only way around is using a high probability system with clear-cut mechanical rules to follow, leaving very little room for interpretation. Unfortunately, teaching your brain and unconscious mind new tricks will be a very long-term endeavor: habit change is one of the hardest to do for humankind. However, operating with a high probability system and learning new rules can get you the chance to make long-term income from the financial markets.

You are invited to experience through an interview what a solid system and rules can do for you and why. Experience through 18 questions, what can make a change to your trading results:

1. Why did you choose the name NeverLossTrading?

We are teaching concepts of adjusting trades instead of taking the stop loss. Hence, our brand name derives from Never Stop Loss Trading, but it was a bit lengthy. We are offering high probability algorithmic trading systems and strategies. We do not want to convey that you never lose a trade with our systems and concepts. But, we want to share that when you use our systems, apply the rules and strategies we teach, you operate in trade situations that lead by 65% or more to a predictable outcome. By that, you will have an edge in the market for producing long-term wealth and income, rather than lose in trading. If trading was easy, nobody would ever go to work. It is not, but it is learnable. In addition, the referring domains for the brand needed to be available too. NeverLossTrading and the hosting company Nobel Living, LLC (a Florida Company) was founded in 2008.

2. NeverLossTrading strategy developed?

The financial markets of the world are institutional money-driven. Big money has to scale in and out of positions, and such leaves a measurable trace to predict future price actions. Price is the result of a change in supply and demand. Our indicators measure the underlying shift in supply and demand to spell out directional price movement potentials with a high probability ≥ 65%. The NLT concept development is based on signal theory: filtering content from actual modulated happenings in price action, volume, and volatility. You can also say: we are filtering signal (a predictable incident) from noise (a random occurrence) to act at crucial price turning points. We have over ten years in the trading education business and solely work one-on-one with our clients to teach and coach our concepts and strategies. Classroom-style training for adults is inefficient. When you look back at years of Spanish classes and how many of the students today can speak the language, you see the inefficiency, which is why we train and coach one-on-one.

3. Do you consider the NeverLossTrading approach theoretical edge-based, fundamental, macro, discretionary, systematic, or a combination?

The NeverLossTrading approach uses the theoretical edge of entering and exiting entire positions as a retail trader; faster than institutions can. Private investors have no way to beat Wallstreet in analyzing fundamentals better than they can. However, when investments into assets occur or a sell-off, our indicators measure the underlying change in supply and demand and alert us about the opportunity. We then trade time-based or price-based and exit before the price move comes to an end. Finally, we teach risk-limiting strategies to operate and crucial price turning points with risk-contained approaches, creating an edge for you as a retail trader.

4. Why does it work?

We are happy to invite you to go through multiple charts together, letting you experience what our systems can do:

contact@NeverLossTrading.com Subj. Demo. You can also check out our YouTube channel or Blog for examples.

Here is the price move model we follow:

NeverLossTrading Price Move Model

NLT Price Move Model

Theory: Key asset holders will have a solid need to re-balance their inventories. Thus, at a particular price expansion, they will either float- or shorten supply, which will result in an opposite directional price move that will then take away from our profits. Knowing this, we pre-calculate how far the expected price move will reach, and there we take profit,  assuming it will retrace or reverse after.

Our systems are productivity tools, and by combining them, you produce a higher participation rate and higher returns.

NLT System Index Productivity Comparison
NeverLossTrading Systems Compared on a Productivity Index

5. How many and which inputs are used to generate a signal? Are they similar for each market? If not, how do they differ? How many different signals per market?

Our indicators work in the same way for every asset, time frame, or price range. System-based, we use a combination of multiple indicators to determine crucial price turning point potentials and only participate in directional opportunities when other market participants confirm the trade direction. For example, in the NLT Price Move Model, the SPU (Speed Unit) is the determining factor to describe how far the system extrapolates the price movement and corresponds it with a stop level to determine if the trading opportunity is acceptable or not.  

6. How many parameters are used?

It is system-dependent. In TradeColors.com, our entry-level system, we use pure price action to determine trading opportunities. In more advanced systems like NLT Top-Line, we use multiple parameters to select a trade situation: Price action, Volume Activity, Correlation to the Market, Money Flow, Statistical Volatility. All systems auto-calibrate and do not need resetting, updating or upgrading.

7. Is there any optimization?

There is no need for optimization; all indicators are autocalibrating, and such the systems auto-optimize themselves. We integrate optimization in our teaching and coaching: In a period of one to three months, we work together with our clients to find and execute trades. We also offer programs to do this continuously, helping our clients to perform at the highest rate of potential achievement. Journaling and discussing good and bad trades is an excellent way to optimize the usage of our concepts. We provide journals that help record and appraise trade entry, exit, time in the trade, and our trade adjustment methods instead of getting stopped out.

8. Are you always in the market? What determines if you are neutral?

In our systems: NLT Top-Line and NLT HF, we use a purple zone, which is a zone of no trades because the direction is unclear. Why purple? We indicate up-moves in blue and down-moves in red; when the direction is vague, red and blue mix, painting a purple zone, and we wait until it ends to continue trading.  

9. What is your exit strategy based on?

Our tool to calculate the expected price move is the SPU = Speed Unit, and it indicates how far a price move shall reach until it comes to an end. 

With our systems, you can operate with conditional buy-stop and sell-stop OCO orders (one-cancels-the-other). Without the need to be in front of your computer for the orders to execute. You are entering by price thresholds, ensuring that other market participants have the same directional assumption as you do and exit at the SPU target or adjust the trade at the stop.

NeverLossTrading SPU (Speed Unit) explained

By a change in the frequency and amplitude of the price movement over time, we specify indications to act on high probability price turning points, applying mechanical rules rather than leaving room for interpretation.

10. Describe your approach to risk management?

We teach risk-limiting strategies and specify by relating risk to reward (mechanical rules) if an opportunity is risky – no-trade – acceptable or favorable. This approach accounts for all asset classes, time-frames, price ranges, or ticks. We propagate for most situations to accept a maximum risk of 1.2-times the reward of the trade situation. With our more advanced systems: NLT Top-Line, NLT HF, NLT Trend Catching, a dashboard reading is telling the reward/risk relation of the actual situation.

11. Is a profit perspective incorporated in your system? How is it determined? How do you manage your portfolio?

We work with every individual to build a business plan that contains an action plan (when to trade and when not) and a  financial plan. The financial plan considers trade preferences like day trading, swing trading, longer-term investing, available time, and preferred markets. We adjust to what people like to trade and do not determine what they need to do. Instead, we jointly build a concept that relates opportunities per time unit, times probability for building a portfolio strategy. Then, depending on the experience level, we create a portfolio that the individual student can manage. Here is an example:

NeverLossTrading Financial Plan Model

The model shows that the student strives for 50% of the desired income from day trades by trading futures, while most of the capital engaged is invested in stocks. By this financial plan, the client strives for an 8.3% return on capital per month.

We are looking to engage about 80% of the capital in the financial model, leaving 20% for hedging potentials, leveraging, or protecting actual positions.

12. What markets are traded? What conditions have to be met for a market to be incorporated into your portfolio?

Our clients trade Stocks, Options, Futures, FOREX with our systems. You will learn which assets in each category offer favorable trade setups over others. We are open to working on a portfolio with price movers that suit the affinity of every trader. When one likes to trade stocks, we help with combined stock and options strategies to limit risk and leverage returns. We will teach the use of Futures strategies for speculation and hedging; however, we do not force students to apply all these; even so, we find them useful. We propose to our clients to create multiple income streams and always operate with risk-limiting strategies as the basis for long-term trading success.

13. What is the portfolio allocation model? For example, is there a minimum/maximum amount allocated per market?

Let us answer through an example: when combining stocks with options, the minimum unit of trading is 100 shares. When you choose to hold Futures longer-term, the allocated margin is the maintenance margin of the underlying. However, risk defines the portfolio holdings. Therefore, we promote allocating to the portfolio by risk units and potentially use futures to hedge the entire portfolio. This way, you are less exposed to a market turn in the overnight session where you might not be able to control your portfolio of holdings. We teach this in multiple hours of working together, and our clients experience more than we can put in a summary here, but what we teach is learnable.

14. Does the unit size ever change?

We take a percentage risk of the entire portfolio, and one holding shall not contain a higher than 5% risk of the account holdings per trade. To decide the level of risk to take, we are using a probability model, and by this, the allocated lot size per trade differs from opportunity to opportunity. We propose an up to 80% capital engagement rate. The remaining 20% of the capital is reserved for potential portfolio hedging.

15. What is the maximum margin to equity ratio? What would be the percentage loss of the portfolio?

Traders have a different affinity to risk, and we help individuals build a portfolio that suits their risk tolerance and income expectations. Again, we recommend taking a maximum risk of 5% per trade and no more than two positions in the same industry segment. Based on this, we calculate the maximum potential risk with each client and define where to put a hedge in place that auto-executes, in case of a market move in the overnight session, when neither stocks nor options can be traded. We leave excel-based financial models with each client to change and optimize. Undoubtedly we also offer to work with us continuously.

16. At what point in asset size would you say: performance can be diluted?

Performance always matters. For example, when you trade from a weekly chart, your maximum stay in the trade shall be five weeks. You exit your trade when either your SPU-based price target is reached or at the closing of the fives candle. We do not hold assets for pleasure. They are investment units that shall produce a return. We encourage you to re-invest into new opportunities and constantly turn your capital.

17. What is the minimum capital requirement to trade this strategy effectively?

The capital requirement varies by affinity to the asset classes one wants to trade: FOREX pairs can function as very applicable assets for small account holders. It would help if you worked with a broker that allows unit allocation; then, FOREX is the most flexible asset to trade for smaller account holders. Some futures traders allow day trading with a $500 margin unit; futures are great day trading instruments for smaller and bigger accounts. If you want to trade stocks and stock options effectively, SEC rules require you to hold a minimum of $25,000 in your account to short stocks and produce more than three day-trades per week. Hence, there is a strategy for every account size, and we work with our clients to find out what suits them best.

18. What are your infrastructure, manpower, budget needs?

You only need a computer or laptop with a sound graphics card, and you are in business. Our mentorships range from $2,500 to $9,997, and our monthly subscriptions to the NLT Alerts from $99 to $495. The choice is yours, and we work with you to find out which system and mentorship you get the most return. We are happy to meet with potential clients to determine assets and time frames to trade and demonstrate how our systems work at or above 65% probability. One hint, more than 50% of our clients, buy more than one system with us. Why is that? After their trading paid off their tuition for the first system, they added another for achieving a higher participation rate and higher returns.

Trading is a beautiful business with minimal setup costs and can be conducted from any place in the world as long as you have internet access, either as a:

  • The main source of income
  • Additional income
  • Retirement planning

When we work together, our concepts range from Retirement account trading (IRA 401(k)) to swing and day trading from margin accounts.

A lot is possible, so do not hesitate to contact us:

contact@NeverLossTrading.com Subj. Demo.

We are happy to get together with you and find out which of our systems best suits your wants and needs, helping you to solve five major dimensions of trading, where many mistakes can be made:

  • Trade entry decisions
  • Exit decisions
  • Stops (where to place them)
  • Maximum time in a trade
  • Risk to reward
Dimensions of Trading Decisions

In addition: we are offering a year-end special you do not want to miss out.

We are happy to hear back from you.

Thank you for your time,

Thomas Barmann (inventor and founder of NeverLossTrading)

www.NeverLossTrading.com

Disclaimer, Terms and Conditions, Privacy | Customer Support

Saturday, October 16, 2021

Free Trading and Investing Magazine

Knowledge is power; however, the most common trading knowledge is not common knowledge. Let us share what is needed in today’s markets by inviting you to read the Traders World Magazine #82 for free.

Traders World Magazine

You will find several articles explaining what is needed for trading our days.

On page 61 forward, we will relate to:

Find Your Trading Edge

Read and download your personal copy.

For questions: 

Call +1 866 455 4520 or contact@NeverLossTrading.com 

Stay informed and subscribe to our free reports and webinars.

Good trading,

 
Thomas


Disclaimer, Terms and Conditions, Privacy | Customer Support

Tuesday, October 12, 2021

Anticipate Price Action for High Probability Trading

 Summary: Join the world of high probability trading by combining an existing system with the newly developed NLT SPU Move Indicator to trade at critical price turning points.

A successful trader has a systematic way to anticipate the future price action of assets like stocks, futures, FOREX.

Not successful traders act reactive and often start to enter into a price action when it is right at the point where it ends, reverses and takes your money.


Unfortunately, 76% of the retail traders are losing money (get the details: email to contact@NeverLossTrading.com Subj. 76%).

Make a difference!

In our yearend offer 2021, we combine the newly developed NeverLossTrading SPU Move Indicator with TradeColors.com or other NLT Systems, helping you to trade at significant price turning points, and you get the second indicator for free: a $3,997 value.

E-Mini S&P 500 Futures NLT Timeless Day Trading Chart  


Chart Review

Entry Rule

Signal

Result

Situation-1


Early entry into the price movement by the lower signal, confirmed by the pride chart signal

win

Situation-2

Upper and lower indicators agree to go short

win

Situation-3

Upper and lower indicators agree to go short

win

Situation-4

Upper and lower indicators agree to go short

win

Situation-5

Long trade by the lower indicator

win

Situation-6

Upper and lower indicators agree to go short

win

In the example above, we used a range bar chart where each candle is painted when a high/low-price-move of 40-ticks is concluded (10 Points). In essence, you are trading for a minimum price change of $500 per contract. The screenshot shows the price action from September 29 to 30, 2021.

Does that mean a 40-tick chart has the superpower to determine where the prices for the E-Mini S&P 500 Futures are going?

No, the tick range to choose is dynamic and throughout 2021 varied between 20 and 50 ticks. Our algorithm tells you the tick/range to select for observing the price movement asset by asset going forward.

TradeColors.com is our introductory concept to algorithmic trading, and with our yearend offer for 2021, we upgrade it by adding the NLT SPU Move indicator (Find more details in this publication…click).

We help traders in multiple dimensions:

·       System-defined trading opportunities at crucial price turning points

·       One-on-one training suited to your wants and needs at your best available times: learning classroom style is inefficient. Each session is recorded so that you can repeat the learned.

·       Executive teaching from a success coach, experienced in bringing the best out of people, giving focus, sharing concepts, providing calculations and documentation in mentorships to ensure you are on the right path.

Indeed, this system also works for time-based charts and all asset classes: stocks, futures, FOREX, and their derivatives, like options.

Our systems formulate price thresholds: Buy > and Sell <. Only when those are confirmed in the price movement of the next candle, we enter into a trade. Thus, we always trade for a pre-defined directional price movement and exit the trade when it is reached. This way, you operate with mechanical rules that leave very little room for interpretation. 

SPY NLT Daily Chart (ETF of the S&P 500 Index)


Chart Review

Entry Rule

Signal

Result

Situation-1


Early entry into the price movement by the lower signal, confirmed by the pride chart signal

win

Situation-2/3

Upper and lower indicators agree to go long, and the direction is re-confirmed during the price movement

win

Situation-4

Short opportunity by the upper and lower signal

win

Situation-5

Upper and lower indicators agree to go short; however, no trade, by the gap

no trade

Situation-6

Only the trade-color-combination-candles direction was confirmed

win

Situation-6

Upper and lower indicators agree to go long, but no trade by the gap

no trade

Our FOREX example demonstrates that the system also works on short time frames; however, we encourage our traders to trade for meaningful price movements to keep the odds in their favor. 

EUR/USD 10-Minute Chart Example, October 8, 2021

Our systems measure the underlying activity of supply and demand to define critical price turning points.

Experience live: contact@NeverLossTrading.com Subj. Demo.

We are a primer education institution focusing on one-on-one training, where you and your wants and needs are in focus.

Sign up for our free reports, trading tips, and webinars.

Our yearend offer:

Buy TradeColors.com for $2,642 and get the NLT SPU Move Indicator for Free: a $3,997 value.

This offer is limited…do not miss out: contact@NeverLossTrading.com Subj: Offer 2021

www.NeverLossTrading.com

Disclaimer, Terms and Conditions, Privacy | Customer Support

Thursday, September 30, 2021

Trading the Frequency of Price Change


Experience how we can extrapolate crucial price turning points with the help of a new NeverLossTrading indicator that works as a standalone and in combination with other NLT Systems and TradeColors.com by measuring the frequency of price change. 

We have an exciting yearend promotion running that you do not want to miss out on. 

Best read our write-up and watch the video with the following link... click.

With the NeverLossTrading concepts and education, we want to help you de-complex trading decisions and come to high probability trading by solving the challenges with our systems' help by working with mechanical rules instead of guessing.

Five Dimensions of Trading and Investing Decisions


Follow our free publications and webinars…sign up here, and we are looking forward to hearing back from you,

www.NeverLossTrading.com

Disclaimer, Terms and Conditions, Privacy | Customer Support