Do you like to invest in industry sectors like Technology, Energy, and indexes like the S&P 500 and the NASDAQ 100?
If yes, we offer a tool for you: our newly developed Impulse Long/Short Price Move indicator that helps you to form sound decisions at crucial price turning points. With the help of our algorithms, you will spot and follow institutional money moves.
For your best performance, we want to support you with leveraged long and short strategies that work from any account, even IRA and 401(k).
Investing in ETFs offers you the advantage of immediate diversification. Moreover, with the help of our concepts and strategies, you will be able to act on institutional sector rotations: money leaves one sector and is invested in another. Our indicators highlight crucial price turning points for you. We also offer you to learn options trading strategies that limit your risk and leverage your opportunity. ETFs, combine the flexibility of stocks and the portfolio-diversifying strengths of mutual funds and give you an affordable way to access a wide variety of asset classes.
The market offers a wide variety of ETFs, and we help you specify the best in class with solid daily trading volume and strong options chains.
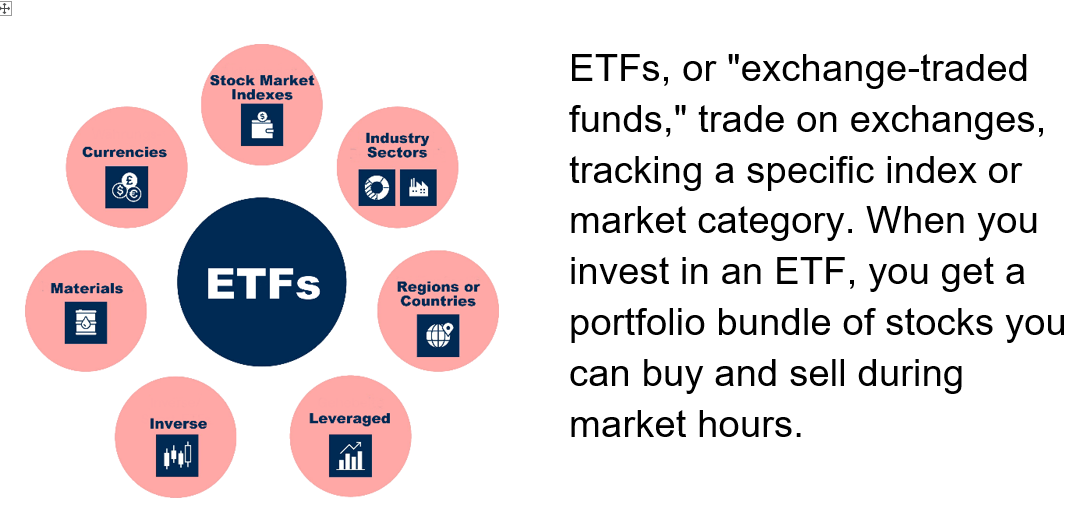
Categories of ETFs
Hence, ETFs offer the diversification of a mutual fund but are tradable like a stock on an exchange.
When you want to enter or exit a mutual funds position, your position will be opened or closed at the end of the next day. ETF positions, with adequate offers, open and close immediately during market hours, some even trade for extended hours when the US equity market is closed.
ETF trading is regulated by SEC rules (Security Exchange Commission), treating ETFs as equities where short selling is only allowed in margin accounts that hold more than $25,000. However, we will provide a solution to cope with this case by options trading strategies and recommend focusing on ETFs with solid options chains, sharing some in our examples.
We embed and offer the new NeverLossTrading Impulse Long/Short Price Move Indicator with either TradeColors.com or NLT Systems. Additionally, our teaching and coaching sessions are individual at your best available days and times. This way, you get the best and fastest learning experience on algorithmic trading with human interaction. You will stay the captain of your trading and investing strategy to form highly probable decisions based on indicators that spot the underlying change in volatility and extrapolate price moves.
Watch our video to see what our decision-making concepts offer. Contact us, and we will find a moment to see what we can do for you:
We have more than ten years in the trading education business and helped many make fruitful financial decisions. We work one-on-one only. In our yearend special, we integrate the new indicator into our systems for a marginal extra.
You might ask yourself why we propagate trading options on ETFs.
Answer: Because you do not need to work with a stop.
Our brand name NeverLossTrading derives from the idea of Never Stop Loss Trading, and you will learn the details when we work together.
If you work with a 401(k) portfolio, we teach you how to cross the offered mutual funds and decide chart based on when to buy or sell.
If you like to read our documentation on the new NLT Impulse Long/Short indicator, email us: contact@NeverLossTrading.com, ETF PDF
To succeed in trading, you best work with an experienced coach and learn much about trading. Our #1 competitive advantage is the support and customer service we offer. We work one-on-one with you to specify what we teach to your specific wants and needs; hence, if your knowledge base is not expanding rapidly, you are doing something wrong.
Ongoing education and mentoring are crucial to longevity in this business. Veteran traders have been through more ups and downs than you can imagine. So, experienced pros have probably experienced whatever you’re going through.
If you are ready to make a difference in your trading:
We are happy to share our experiences and help you build your trading business. Trading is not a typical career, and you best learn from those who are long-term in this business to cope with the rollercoaster of the financial markets. We are here to help and provide feedback on what you might be doing right or wrong.
Strive for improved trading results, and we will find out which of our systems suits you best.
The markets changed, and if you do not change your trading strategies with them, it can be a very costly undertaking.
We are looking forward to hearing back from you,
Thomas Barmann (inventor and founder of NeverLossTrading)
Summary:Follow a sound path of acting at crucial price turning points as a day trader, swing trader, or longer-term investor.
Our headline question: “Is there Always Something to Trade?” reflects an inherent problem embedded in trading. People from different careers enter the world of trading with a work attitude – wanting to get things done, with a need to trade to feel comfortable that they accomplished something. However, pros propose only acting at moments and assets with price moves.
When trading the financial markets, you invest your money for a certain period to yield a return:
Day trading (opening and closing positions on the same day)
Swing trading (holding positions for multiple days)
Longer-term holding, like for weeks and months, we define as investing
Behaviorwise, the action of trading or investing is the same. However, trading leaves you less time to form decisions. In essence: You need a sound decision-making basis to yield repetitive returns from the financial markets. Unfortunately, the ones accepting your offer to buy or sell an asset are ready to take your money. Thus, there is no risk-free return in the financial markets, which spins a multidimensional challenge:
Find assets with a high probability chance for a return
Limit the risk so the risk and reward remain in a meaningful relation to yield a return
Only act when the odds are in your favor
As a trader, you are a probability thinker, making financial decisions by calculating the odds for you to come out favorably.
A simple formula for trading with the odds in your favor would be
If you operated by this imperative, you would not risk your money if the formula equation is not fulfilled.
Institutions appraise balance sheets, management ability, sector strength, competitive advantages and a long list of specifics to which private investors have either no or very late access. Hence, we recommend not competing on fundamentals, but spot and following price moves when they occur. Invest or trade when others have done the groundwork for you and show their cards for you to follow their actions. As a private investor, you can open and close entire positions where institutions have to scale in and out, not drastically to change underlying asset prices.
A recent example: Warren Buffet just swapped GM shares in his portfolio against TSN, and the BRK/B stock had a positive development. So let us check how our indicators put critical price turning points for Berkshire Hatheway on a weekly NLT chart composed of NLT Top-Line and NLT Trend Catching indicators.
The chart shows six potential trade situations: two with a no-trade indication. In the no-trade situations, the price threshold formulated by the indicator: buy > was not surpassed in the price movement of the next candle. As such, the entry condition for executing a trade was not fulfilled. On the other hand, four situations led to trades and came to target (dot on the chart). All trade situations fulfilled the desired risks/reward conditions and allowed the placing of buy-stop or sell-stop orders. This way, you did not need to be in front of your computer at market openings.
BRK/B, Weekly NLT Top-Line and Trend Catching Chart
Of the four situations, two were long-trading opportunities and two asked for trades to the downside. The BRK/B stock is HTB (hard to borrow); by this classification, the stock is unavailable mainly to borrow from your broker for short-selling. Short selling is not allowed if you trade from an IRA; however, we have a solution: operating with an options strategy. BRK/B has a solid options chain, and we share in our mentorships the NLT Delta Force concept: a simple options trading strategy that defines:
The options delta to operate with
The time to expiration to choose
The maximum price to pay or swap to a different strategy
This way, we are de-complexing options trading strategies and allowing you to limit the risk and leverage returns from each type of trading account. The average time to Target-1 was between one and two weeks, and the average return of an options trade was 100%.
The chart shows that half of the opportunities were short-selling situations, asking you as an investor to have an adequate strategy to follow the market direction.
If this is something you want to learn, talk to us about what our systems can do for you:contact@NeverLossTrading.com Subj.: Demo, and ask for our year-end special.
The example also showed no need to stay engaged in BRK/B after reaching the trade target. Instead, you had the chance to invest your money in another asset.
Our TSLA example shows how important it is to have strategies on hand that help you to follow the price direction to the downside: TSLA as BRK/B is hard to borrow as a stock, but our NLT Delta Force Options concept keeps you in business!
TSLA, Weekly NLT Top-Line and Trend Catching Chart
Aside from weekly charts that function more for longer-term investments, our indicators also work for swing and day trading.
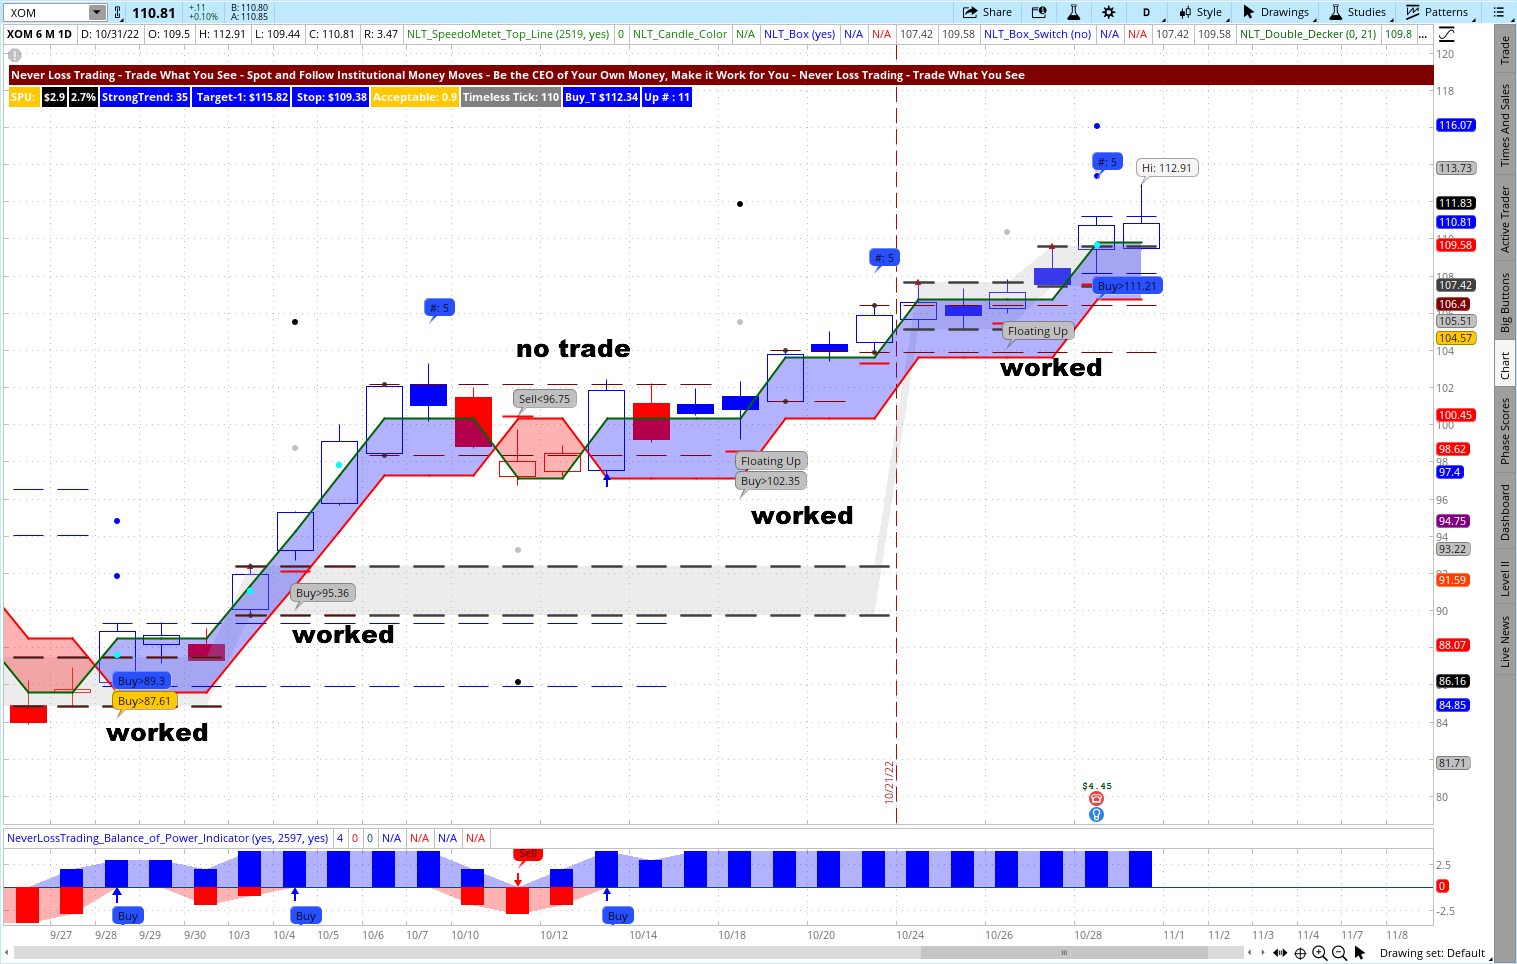
The XOM daily chart shows multiple trading opportunities along with the up-trend development we follow with our NLT Trend Catching concept.
XOM, Daily NLT Top-Line and Trend Catching Chart
How to find those opportunities?
NLT Top-Line offers market scanners that help you find and act on assets with crucial price turning points. In addition, we offer a subscription to the NLT Alerts, highlighting assets ready for a price move: Stocks, Options, Futures, and FOREX. Our NLT Alerts are excel-based, so you can modify them to your specific needs, and we highlight assets based on monthly, weekly, daily, and 4-hour price developments.
Our headline question was: “Is there Always Something to Trade?” If you are a longer-term investor or swing trader: Let your system pick when it is time to trade, and when there is nothing to trade, stay in cash and ready for the next price move by letting the chart tell when to buy or sell.
If you like day trading, pick assets that are easy to trade long and short without HTB restrictions: Futures are excellent assets that fulfill this requirement. For day trading, aside from following time-based happenings, we apply the concept of NLT Timeless Trading, where we purely follow price action. Helping you to act at crucial price turning points with less predictability. Here is a chart example for the E-Mini S&P 500 Futures Contract:
/ES, NLT Timeless Day Trading Chart
The chart shows three trading opportunities between 9 a.m. and noon ET; all came to target. Each trading opportunity was good for a price move of about $400 per unit traded and complied with the demanded risk/reward definition of trading with the odds in your favor. Acting on crucial price turning points is essential for you as a trader to achieve long-term profitability. However, you are dealing with risk in each situation, and there is no 100% certainty that the trade will come to your desired target. We focus on high-probability trade setups; our brand name does not mean you never lose a trade; it derives from the concept of trade repair instead of accepting the stop-loss.
Crude Oil Futures, NLT Timeless Day Trading Chart
The Crude Oil Futures Example shows four trading opportunities; three were winners, and one lost trade. Each situation was good for a value change of the underlying contract of about $300. When you add the opportunities of the E-Mini S&P 500 and Crude Oil Futures Contract, it gives you many opportunities to participate in directional trades at crucial price turning points.
To succeed in trading, you best work with an experienced coach and learn much about trading. Our #1 competitive advantage is the support and customer service we offer. We work one-on-one with you to specify what we teach to your specific wants and needs; hence, if your knowledge base is not expanding rapidly, you are doing something wrong.
Ongoing education and mentoring are crucial to longevity in this business. Veteran traders have been through more ups and downs than you can imagine. So, experienced pros have probably experienced whatever you’re going through.
If you are ready to make a difference in your trading:
We are happy to share our experiences and help you build your trading business. Trading is not a typical career, and you best learn from those who are long-term in this business to cope with the rollercoaster of the financial markets. We are here to help and provide feedback on what you might be doing right or wrong.
Strive for improved trading results, and we will find out which of our systems suits you best.
The markets changed, and if you do not change your trading strategies with them, it can be a very costly undertaking.
We are happy to hear back from you,
Thomas Barmann (inventor and founder of NeverLossTrading)
Summary:Successful traders distinguish potential price moves that are random happenings from price moves that can be forecasted with a high probability. The science or art is in detecting signals and staying away from Noise.
More than 85% of all financial market transactions are institutional decision-based. Therefore, big money decides the direction and if a price-movement-initiation spotted is followed or countered. Hence, the market creates signal patterns that are detectable and predictable with a high probability. As a high probability situation, we specify a 65% or above predictability of the happenings to continue in the forecasted price direction.
Let us take a signal transmission model: Filtering technology helps to detect the signal and filter out Noise. Even when a signal is distorted, models like the Hamming Distance help to identify the underlying movement and fill in what is missing to forecast the content to a specified target.
At this point, it might sound abstract; however, it builds a crucial part of our algorithmic trading systems with an AI component. For programming such a system, you first describe the natural happening, and such, we formulate some of the observations to take:
How do financial market transactions take place?
Who are the decision-makers, and what is the basis of their decisions?
How and when do price moves start and end?
Next is to find a mathematical model to replicate the actual market happening. Let me give you some examples:
We are assuming a Markov-Chain-Happening: forecastable action in a predictable frame of activities instead of considering a Finetti relation of a random happening.
Mandelbrot iterations help us to consider the action of now: The result of each market action is used as the starting value for the next iteration. The values are checked during each iteration to see whether they have reached a critical “trade” condition or “bailout.” If a trade condition is found, the calculation is stopped, and a potential signal is drawn on the chart, spelling out the next price value to be reached and the statistical volatility to get to the examined target value without a high likelihood of getting stopped.
Filtering technology to express higher over lower likelihood happenings
Price expansion calculation and stop, considering the actual statistical volatility of the happening.
What we explain above and more happens in the background, and we wanted to invite you into our thinking. However, you do not need to understand and learn all this. Still, we wanted to express that simple moving average calculations, or similar iterations will never be able to provide high probability trade setups. So we calculated the difference between a model with a 55% probability to one of 65% and estimated the expected win rate of 10 trades by a Bernoulli experiment to win six or more trades out of ten. We explained how to put together an experiment with marbles, but let us take a shortcut here:
A 65% system gives you a 75% chance to predict and win six or more out of ten trades.
A 55% only gives you a 50.4% chance for six or more winners (random predictability).
You know now why we propagate high over low probability for retail traders.
We offer several systems: TradeColors.com is our beginner system and is included in all other systems. In this publication, we like to share a combination of NLT Top-Line, Trend Catching, and NLT Timeless Indications.
NLT Top-Line has multiple price charts and lower study indicators for trading at crucial price turning points:
Strong Price Turning Points: NLT Power Towers stand tall and point a direction (blue and red, buy> and sell<)
Tops and Bottoms: NLT Early Buy or Sell, pointing out more considerable directional price moves (orange buy>, sell<)
End of Purple Zone. We color up-moves in blue and down moves in red; when a time of ambiguity in price direction (purple buy> and sell <).
Strong money in our outflow, showing institutional engagement (lower study)
Correlated or uncorrelated to the overall market move (lower study)
Historical price projection to understand what others expect (upper and lower study)
and more
NLT Trend Catching differentiates
Trend Initiation Signals (gray buy > and sell <)
Trend Continuation Signals (gray Buy_C and Sell_C)
Balance of Power: Buyers or sellers in Charge (lower study)
Why combine those systems?
For a higher participation rate: more trades and accuracy with indicators that take a different market cut by not being correlated.
NLT Timeless Day Trading Examples /ES
The chart works with price-based candles, not time-based. During the day session, three trading opportunities were highlighted, and all reached their target.
For day trading, we always operate with bracket buy-stop or sell-stop orders. The order is only filled when a pre-defined price level is reached and automatically stops and targets in place.
In our trading chart, we also consider price-volume happenings, and the colors on the volume bar tell a story of higher-level engagement on highlighted bars. The price-volume study is part of NLT Top-Line, and we run a yearend special for the system combination, which we are happy to share with you in a demo.
Following specific rules in trading is essential, leaving only very little room for discretionary decisions. Very little interpretation:
Trade What You See!
Let the chart tell when to buy or sell!
By the way, the brand name NeverLossTrading does not promise never to lose a trade; it derives from the concept of trade repair and Never Stop Loss Trading was a bit lengthy.
The following example shows an NLT Timeless Swing Trading example:
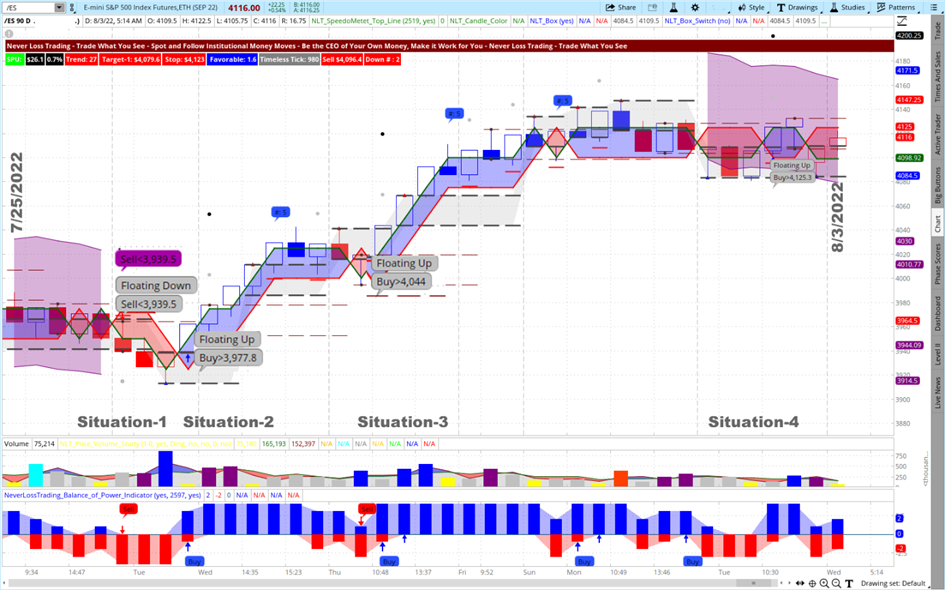
NeverLossTrading Timeless Swing Trading Chart
The chart shows NLT trade indications between July 25 and August 3, 2022, describing four situations we now explain:
Situation-1: After directional price ambiguity, the NLT Top-Line End of Purple Zone signal and the NLT Trend Catching Sell signal pointed down, and the trade direction was confirmed and came to target by reaching the gray dot on the chart.
Situation-2: A bottom was found, the buy signal confirmed, and an upside trade was initiated. The first target was at the gray dot. If you want to trail your transaction, use the red line of the blue frame and exit at the black dot or 3-SPU level.
Situation-3: A trend-continuation signal after a short retracement and another uprun to target or to be trailed with the red line the black dot: 2-SPU level.
Situation-4: on August 1, 2022, an NLT Purple zone opened and told us not to initiate swing trades until it was over.
After the NLT Timeless examples, let us dive into time-based trading: We use the same indicators and pull up a price chart for Apple Corp. (AAPL) from June 8 to August 3, 2022.
Do you see four or potentially five trading opportunities (one short – sell signal in red – and three long opportunities – buy signals in gray and red)?
If yes, you understand what we mean by letting the chart tell when to buy or sell; if not, challenge us for a free demo:
AAPL Daily NLT Chart: NLT Top-Line and Trend Catching
The trade situations on the chart are not magnified, leaving it up to you to test what you see, and when you look closer, you will experience why we say:
Let the chart tell when to buy or sell – trade what you see!
Only if you have a solid decision-making base, supported by a system that helps you to identify high-probability trade setups, will you have the chance to trade for constant income from the financial markets as a time-based or timeless trader. You can learn both concepts in our mentorships and more.
We know and acknowledge that every trader is different. Hence, we tune our systems and teach to your specific wants and needs, supporting you to turn yourself into the trader or investor you want to be, teaching one-on-one at your best available days and times.
Let us share an overview of learning elements to take away from our training and coaching sessions, which vary based on the system you choose, from four to twenty hours of teaching.
Summary of learning elements:
Acting with a system probability > 65%
Mechanical rules for entry, exit, and stop
Trade at perfect moments only
Consider overall factors, patterns
Risk and reward in an acceptable balance
Risk-averse trading
Holding positions to target
Do not add to losers
Stick with a trading strategy. Follow a business plan – action plan and financial plan
Trade for meaningful price moves
Systematic trading
Having a mentor to learn from
We also help you to journal your trades. Such a journal provides excellent feedback on how you are developing, and you will find a perfect example in this article on our Blog: How to Control Your Trading Results
To succeed in trading, you best work with an experienced coach and learn much about trading. Our #1 competitive advantage is the support and customer service we offer. We work one-on-one with you to specify what we teach to your specific wants and needs; hence, if your knowledge base is not expanding rapidly, you are doing something wrong.
Ongoing education and mentoring are crucial to longevity in this business.
Veteran traders have been through more ups and downs than you can imagine. So whatever you’re going through, experienced pros have probably experienced it already.
If you are ready to make a difference to your trading:
We are ready to share our experiences and help you build your trading business. Trading is not a typical career, and you best learn from those who are long-term in this business to cope with the rollercoaster of the financial markets. We are here to help and provide feedback on what you might be doing right or wrong.
Strive for improved trading results, and we will find out which of our systems suits you best.
We are happy to hear back from you,
Thomas Barmann (inventor and founder of NeverLossTrading)
As a day trader, your challenge is to find solid setups and act but not to overtrade. Overtrading starts the circle of doom for day traders: gain, gain, and a significant loss. Imagine if you could schedule to take two trades per day, about $400 of risk and reward per unit, and you close your books after two wins. What would that do for you?
We worked out a concept where we demonstrate that minus trading is more profitable: – = +, and share examples for the E-Mini S&P 500 Futures, Gold Futures, Crude Oil Futures, and Euro Futures.
In a short intro: would it make a difference if you had such buy or sell signals on your chart?
E-Mini S&P 500 Futures Contract on the NLT Timeless – = + Chart
Aside from day trading, we also provide longer-term investment concepts, and you are invited to discuss them with us. One example is a free concept writeup for trading in and out of the earnings season.
Just write us an email, and you will receive how we trade the earnings sean in a PDF format.
We are more than ten years in the trading education business and helped many traders and investors become profitable and independent. We work one-on-one on your best days and times, and we are looking forward to hearing back from you.
Good trading,
Thomas Barmann (inventor and founder of NeverLossTrading)
Trading is a professional business, and the ones who take the other side of your trade are prepared to take your money. However, suppose you follow a high-probability concept. In that case, the financial markets provide a solid harvesting ground, and we invite you to follow the core principles of trading and investing.
Read on, and we will offer you two free publications that help your trading!
The game of tennis provides an analogy for understanding what happens by trading in the financial markets. Imagine a match between a tennis professional and a weekend warrior. They use the same equipment, play on the same court, and abide by the same rules. But the professional will have a better technique and strategy and will be prone to fewer errors.
Does that mean you have no chance of winning as a private investor?
No, this is not the case; with the right tools, you can spot and follow institutional money moves and play the pros game. We provide the systems and strategies to follow institutional money moves as a day trader, swing trader, or long-term investor.
Instead of battling against institutions, we encourage and support you to transform yourself into acting along with the action of professional investors: copying and betting on their magic numbers.
Where is the edge in a follower strategy: As a retail trader, you can enter and exit entire positions at once. Institutions have to scale in and out of positions, not radically change prices; hence, your competitive advantage is in the speed of entering and exiting transactions, but you are still trading on the side with big money.
Here is how our systems and systematics work:
Our systems find assets with potential price moves and appraise the likelihood that they come to a pre-specified target.
When institutional money moves are system-indicated, a price threshold is formulated: Buy >, Sell >. You only open a new position when the formulated price threshold is surpassed in the price movement of the next candle: This is how we secure that you are only investing in a directional move other market participants appraised similarly.
You do not want to trade or invest on your own!
When other market participants invest in the same direction, you will likely bring your trade to the system-specified target.
The high likelihood or high probability is for us, predicting price moves with 65% or above accuracy.
Let us know if you are interested in day trading or longer-term trading, and we will share more details in a PDF study with you.
To succeed in trading, you best work with an experienced coach and learn much about trading. Our #1 competitive advantage is the support and customer service we offer. We work one-on-one with you to specify what we teach to your specific wants and needs; hence, if your knowledge base is not expanding rapidly, you are doing something wrong.
Ongoing education and mentoring are crucial to longevity in this business. Veteran traders have been through more ups and downs than you can imagine. So, experienced pros have probably experienced whatever you’re going through.
If you are ready to make a difference in your trading:
We are happy to share our experiences and help you build your trading business. Trading is not a typical career, and you best learn from those who are long-term in this business to cope with the rollercoaster of the financial markets. We are here to help and provide feedback on what you might be doing right or wrong.
Strive for improved trading results, and we will find out which of our systems suits you best.
The markets changed, and if you do not change your trading strategies with them, it can be a very costly undertaking.
We are happy to hear back from you,
Thomas Barmann (inventor and founder of NeverLossTrading)
Some claim that the stock market development is a random walk; however, this is only the case when you have no tools to analyze the underlying currents of the happening.
We want to invite you to experience and forecast price moves from a new perspective, helping you to participate in up and down movements from any account, even from an IRA.
What appears like a chaotic reaction often has an underlying structure to forecast the happening with a high likelihood. Our algorithms see the price development embedded in a Markov chain, where the next happening is correlated to the last occasion and is not totally independent.
What is coming next in the stock market?
The chart shows a two-year development of the NASDAQ 100 and the S&P 500. Since the beginning of the year, the technology-heavy NASDAQ 100 has been underperforming and dragging the indexes down.
What does that mean for your portfolio if you hold one?
The pressure is on:
There is a solid chance that the indexes will drop another 20% (see the red projection shade on the chart).
Big money managers already took a substantial hit; why should private investors be spared?
12-Months Development of the Largest Money Managers
The table above shows a substantial market capitalization deterioration over the last twelve months. A typical bear market reaction and your portfolio, so you hold one in the form of an IRA, 401(k), or other conditions, might not look much different, and we have not seen the bottom yet.
However, you can make a difference with instruments on hand that project a change in price direction.
BLK on the Daily NLT Top-Line Chart
Like in a seismic reading, pre-eruptions indicate a potential price movement and extrapolate the incident by what has happened before. In our model, the price needs to move out of containment to fulfill the forecasted move with a high likelihood. This way, we anticipate other market participants to trade along with our directional assumption and drive the price move to the forecasted target.
On the chart, we highlighted four potential price turning points. At each, our NLT Top Line indicators pointed the direction to either buy or sell when the formulated price threshold of buying> or selling< were fulfilled in the price movement of the next candle. This way, buy-stop or sell-stop orders are filled:
Situation-1: Buy > $629.65. The price movement of the next candle took out the price threshold, and a long trade was initiated to the second target dot on the chart, where it got, and the trade was closed. Then you had multiple re-entering opportunities after the candles with the cyan arrow and dot, or you could trail the stop with the red line and the lower side of the blue frame.
Situation-2 had an orange sell signal. This signal occurred as an early directional change signal and was followed up by an NLT PowerTower (red signal, Sell < $712.31) and led to a short trade until the second target dot was reached.
Situation-3: Sell < $643.31. The direction of the trade was confirmed by ticking below the set price threshold, and a short trade to the second target dot followed.
Situation-4: Buy > $578.34 was not accepted as a trade potential. The reason for this: V-Shape reversals occur only in 15% of the cases, and we are probability thinkers and only take high-probability setups. Hence we disregarded this first leg up.
Suppose you are trading from an IRA or Cash Account, where short-selling stock is not allowed by SEC regulations. In that case, you learn to participate in the downside price movement by a simple options strategy with the help of the NLT Delta Force Concept:
It specifies the stock options Delta you buy
The time to expiration to pick
And the maximum price to pay for the option
Our concept demystifies options trading and gives you a clear perspective of what to do, how, and when.
For day traders, we are working on an idea where we encourage them to trade less, not more, to reduce the failure rate.
We combine multiple indicators in the chart example of Friday, October 21, 2022.
The chart shows three validated trade indications that came to the pre-defined target.
Dots on the chart are targets
Red crossbars are the stops
Buy and Sell thresholds indicate opportunities
E-Mini S&P 500 Timeless Day Trading Chart
As a trader, you are handling probabilities and only want to risk your money when the odds are in your favor. So let us invite you to two ideas of how to address today’s markets:
As a day trader using NLT Timeless Charts with system-compliant reward/risk setups
As a swing trader or longer-term investor, learning how to operate during the earnings season
We have two publications ready for you, reply if you want to learn more, and we will be happy to share our findings.
To succeed in trading, you best work with an experienced coach and learn much about trading. Our #1 competitive advantage is the support and customer service we offer. We work one-on-one with you to specify what we teach to your specific wants and needs; hence, if your knowledge base is not expanding rapidly, you are doing something wrong.
Ongoing education and mentoring are crucial to longevity in this business. Veteran traders have been through more ups and downs than you can imagine. So, experienced pros have probably experienced whatever you’re going through.
If you are ready to make a difference in your trading:
We are happy to share our experiences and help you build your trading business. Trading is not a typical career, and you best learn from those who are long-term in this business to cope with the rollercoaster of the financial markets. We are here to help and provide feedback on what you might be doing right or wrong.
Strive for improved trading results, and we will find out which of our systems suits you best.
The markets changed, and if you do not change your trading strategies with them, it can be a very costly undertaking.
We are happy to hear back from you,
Thomas Barmann (inventor and founder of NeverLossTrading)