
Since the beginning of 2018, the US-stock market gives traders and investors a challenge that was not present for a long time: increasing volatility.
There are different ways of expressing volatility: Commonly the VIX (CBOE Market Volatility Index) is taken as the volatility measure; however, besides a short spark in February, the VIX still dwells below 20, which is considered low volatility.

On the other hand, we do not need to rely on what the index says to understand if volatility increased or not. Just take a monthly chart and look at the size candles of the core stock market index, then you see what is happening:
NLT TrendCatching Chart for SPX (S&P 500 Index), October 2016 to April 2018
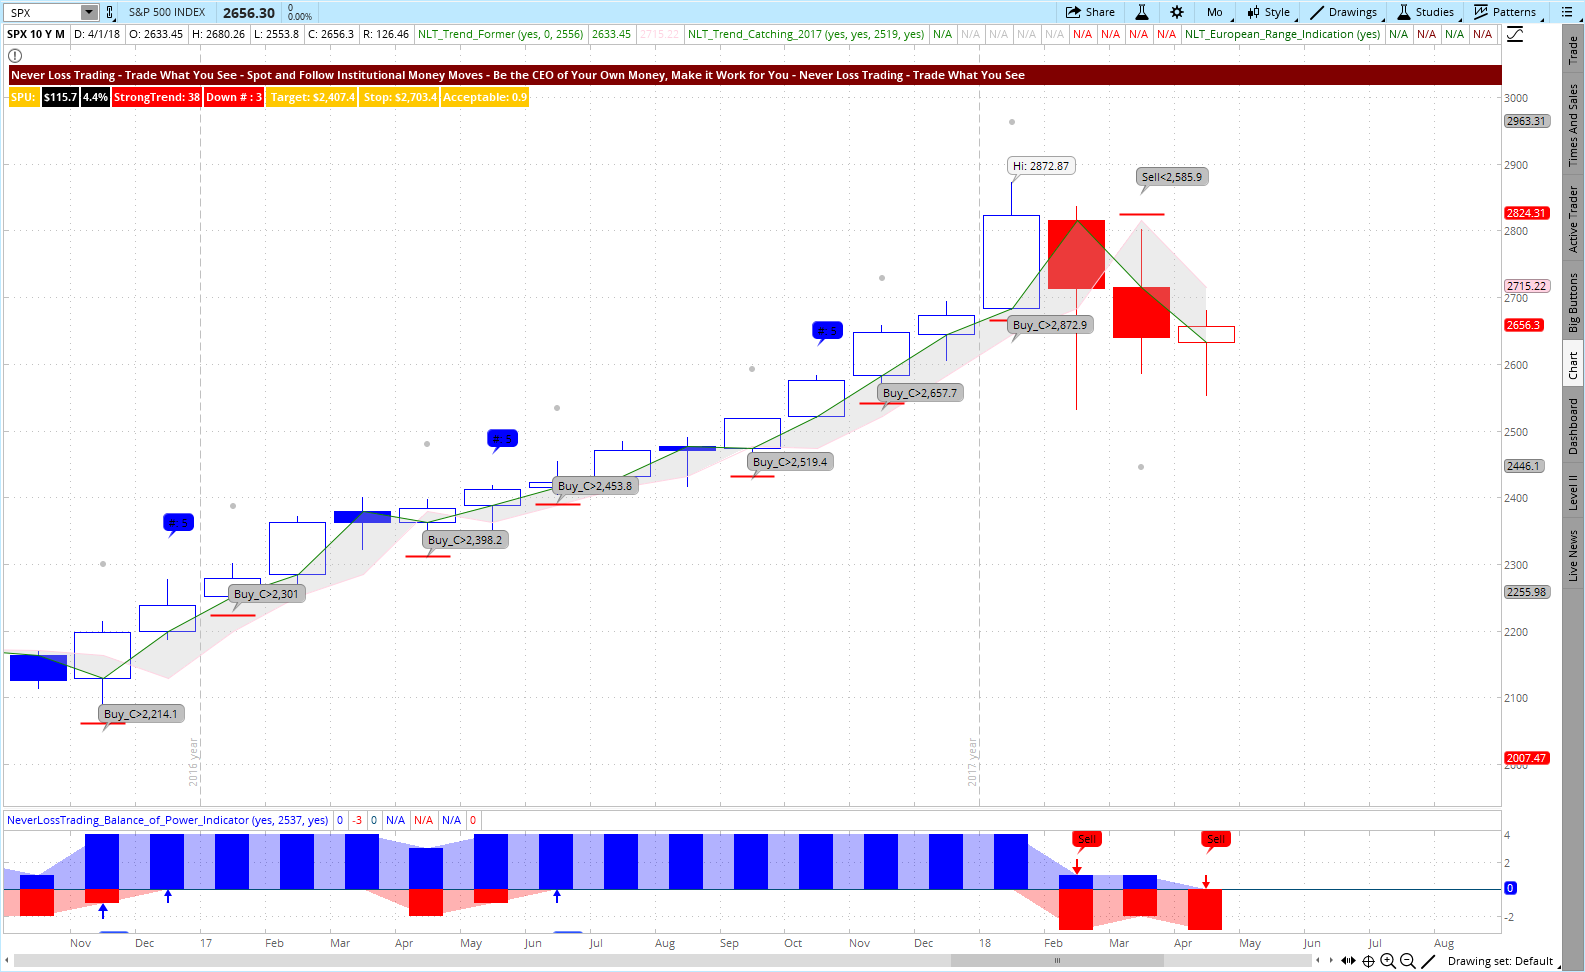
The chart shows you multiple buy signals along the up move until the S&P 500 reached its high in January 2018. In March of 2018, a first sell signal occurred.
How to read the NeverLossTrading Trend Catching Chart:
Back to volatility:
When you look at the size of the 2018 monthly candles, you recognize that they are significantly bigger (top-to-bottom) than all the candles we have seen in the prior months: telling you that volatility increased, and as a trader or investor, you better have strategies on hand to deal with times of higher volatility.
Why do we make this point?
In times of higher volatility, when keeping the same risk tolerance, your risk of getting stopped out in your trades increases; thus you need new trading strategies to cope with the new risk gauge to bring your trades to target.
When trading or investing, we make assumptions, predicting potential directional price moves, while we cannot influence if the price gets to our target; however, we can control the risk by the trading strategy we apply: Meaning, if you prior operated with a 2% stop, in times of volatility, a 5% stop might be needed to follow the predominant price move.
If the increased volatility brings you outside of your risk tolerance, you have multiple choices to still trade and invest:
E-Mini S&P 500 Futures Index on 4/13/2018 with NLT Top-Line and TrendCatching Signals
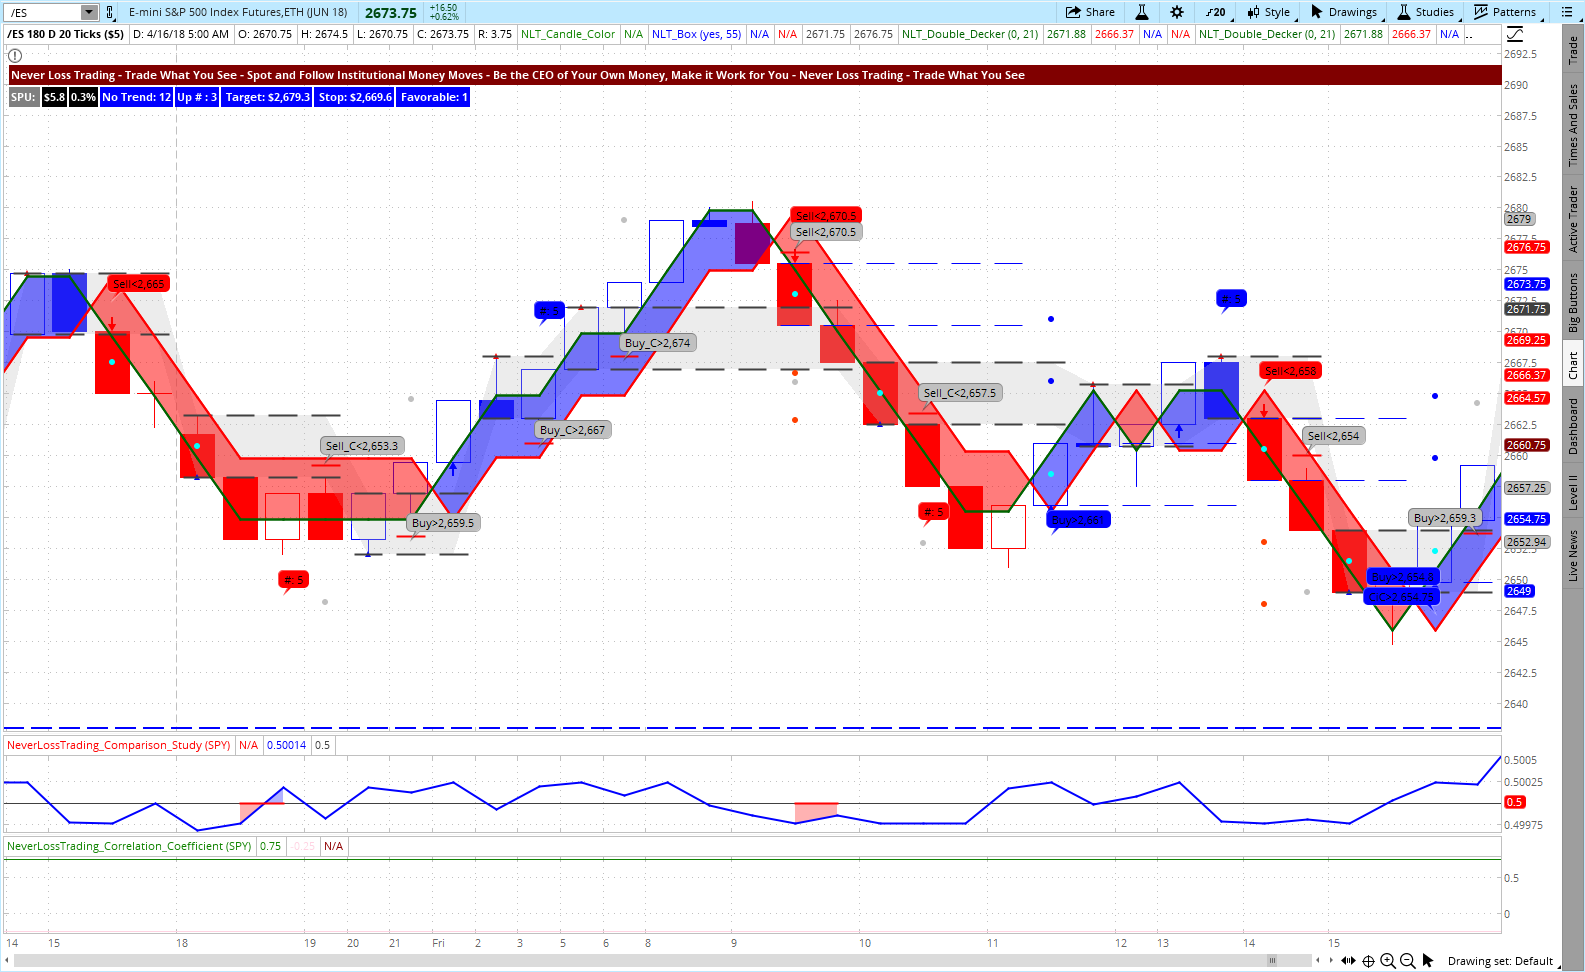
Each price move captured on the chart resulted in a $250 gain/risk based on one futures contract. Just add up the realized directional opportunities of one trading day and you see; how a change in trading strategies can accelerate your opportunities to participate in directional price moves of the underlying multiple times a day.
This is where we come into play and help you to have the trading strategies, systems, and systematics on hand to cope with every trade environment.
To learn more about what you will experience trading the markets the NeverLossTrading way, check out our info page and make a decision..click.
We are in business since 2008 and developed multiple systems and the necessary tools and knowledge base to support you in your aim for trading and investing success. If this is for you and you want to experience how it works live:
Call +1 866 455 4520 or contact@NeverLossTrading.com
If you are not already subscribed to our free trading tips, reports, and webinars…sign up here.
Best regards,
Thomas Barmann
Disclaimer, Terms and Conditions, Privacy | Customer Support
There are different ways of expressing volatility: Commonly the VIX (CBOE Market Volatility Index) is taken as the volatility measure; however, besides a short spark in February, the VIX still dwells below 20, which is considered low volatility.
On the other hand, we do not need to rely on what the index says to understand if volatility increased or not. Just take a monthly chart and look at the size candles of the core stock market index, then you see what is happening:
NLT TrendCatching Chart for SPX (S&P 500 Index), October 2016 to April 2018
The chart shows you multiple buy signals along the up move until the S&P 500 reached its high in January 2018. In March of 2018, a first sell signal occurred.
How to read the NeverLossTrading Trend Catching Chart:
- With the NLT system, you trade or invest when the formulated price threshold is surpassed in the price-move of the next candle: Buy>$2519.40 was indicated end of September 2017 and confirmed in October 2017, leading to going long in the index and we closed the position when the price reached the gray target dot at $2590.40; concluding a 71-point price move. End of November 2017, another price threshold was formulated and confirmed in the next candle and came to target. The last buy signal on the chart: Buy>$2877.90 was final and no more confirmed.
- By the change in color, a momentum change came on the chart, resulting in a first sell signal: Sell<$2585.90.
- The bottom study: NeverLossTrading Balance of Power Indicator, tells you in blue that buyers were in command (blue bars), until in February 2018, when sellers were more dominant.
Back to volatility:
When you look at the size of the 2018 monthly candles, you recognize that they are significantly bigger (top-to-bottom) than all the candles we have seen in the prior months: telling you that volatility increased, and as a trader or investor, you better have strategies on hand to deal with times of higher volatility.
Why do we make this point?
In times of higher volatility, when keeping the same risk tolerance, your risk of getting stopped out in your trades increases; thus you need new trading strategies to cope with the new risk gauge to bring your trades to target.
When trading or investing, we make assumptions, predicting potential directional price moves, while we cannot influence if the price gets to our target; however, we can control the risk by the trading strategy we apply: Meaning, if you prior operated with a 2% stop, in times of volatility, a 5% stop might be needed to follow the predominant price move.
If the increased volatility brings you outside of your risk tolerance, you have multiple choices to still trade and invest:
- Decrease your position size.
- Reduce the time frame you base your trading decisions on.
- Choose option strategies that allow a limited-risk and directional reward opportunity.
- Change to trading strategies that function best at times of volatility.
E-Mini S&P 500 Futures Index on 4/13/2018 with NLT Top-Line and TrendCatching Signals
Each price move captured on the chart resulted in a $250 gain/risk based on one futures contract. Just add up the realized directional opportunities of one trading day and you see; how a change in trading strategies can accelerate your opportunities to participate in directional price moves of the underlying multiple times a day.
This is where we come into play and help you to have the trading strategies, systems, and systematics on hand to cope with every trade environment.
To learn more about what you will experience trading the markets the NeverLossTrading way, check out our info page and make a decision..click.
We are in business since 2008 and developed multiple systems and the necessary tools and knowledge base to support you in your aim for trading and investing success. If this is for you and you want to experience how it works live:
Call +1 866 455 4520 or contact@NeverLossTrading.com
If you are not already subscribed to our free trading tips, reports, and webinars…sign up here.
Best regards,
Thomas Barmann
Disclaimer, Terms and Conditions, Privacy | Customer Support

No comments:
Post a Comment