
A quick answer to the question of this publication:
How to know when to Trade?
Your highest likelihood to catch a price movement is when you identify and trade at crucial price turning points!
In this publication, we want to invite you to a method of finding and acting on opportunities where buyers take over from sellers and vice versa.
To share crucial content, we explain how and why, so enjoy reading more than a Twitter message and contact us for questions: contact@NeverLossTrading.com
A price change is the result of a change in supply or demand. Hence, we can predict price development by measuring and extrapolating underlying shifts in supply and demand.
For specifying crucial price turning points, we use algorithms to put signals or indications of a handover from buyers to sellers and vice versa on the chart for you to trade along with the resulting price movement.
Currently, the longer-term market direction is ambiguous, and we prefer shorter-term trading over longer-term engagement. Hence, day trading and swing trading are in focus.
More than 85% of the orders routed through the exchanges are institutional-based. Thus, the prominent stakeholders’ typical behavior and algorithms define the happening of the markets, and we are assuming crowd behavior: Followers are jumping in the chosen direction of leaders. Thus, our systems ask for confirmed entry price levels. Then, with the help of a price-move-model, a high probable future price move is predicted: By the NLT Speed Unit (SPU), our systems define a future price-point in the natural distribution of prices (following the Markov principle), and when this is reached, we take an exit. The trade orientation is relatively short-term: one to ten bars, and does not follow longer-term price patterns. The trade duration is either defined by a time-based chart or the NLT Timeless Chart, where only price behavior is recorded and builds the basis to predict the future price happening.
The Price Move Model of NeverLossTrading

With our mathematical models expressed in our software, we measure the setup stage of a price move to come and assume prices accumulate before a price move. Our indicators identify this stage by estimating the price-, volume- and volatility development with the NLT-specific market pressure model. In the next phase, prices test the high/low of a price range before the breakout. Alarm settings on the chart indicate when such a situation occurs. Finally, the system notifies you about the price breakout potential, and:
- It is either confirmed – and we trade along with it.
- Or it is not confirmed – and we stay out of the trade.
With NeverLossTrading, we built a natural behavior model, which considers repetitive action in the behavior of leaders and “crowd behavior”: The crowd is following the leaders. Then, we translated this into a trading plan with our mathematical models, which gives us defined entries, exits, stops, or price adjustment levels.
Let us share some examples:
- Stock Trading Examples
Soon, we will be writing the year 2022, where home computers and servers are powerful to process vast amounts of data in real-time. Such, you do not have to screen through hundreds of charts; with the suitable instruments on hand, you can shorten your fairway to trading success.
Here is an example of a simple dashboard relating the expected price move with a reward/risk concept:

Let us jointly read left to right:
- SPU in gray identifies that the price move is average; cyan indicates excessive and orange rising price momentum.
- $7.67 is the expected price move of the underlying stock, and 2.5 identifies the return on cash of a $7.67 price move.
- Trend 25 in blue identifies a slight uptrend, and when you trade this situation, take profit when the stock price reaches $318.02 and place a stop or price adjustment action at $304.14.
- When you trade like this, you expect for every dollar of risk a $1.30 of a return.
Simple and easy to read, now you see it magnified on the AAPL price chart:
Daily AAPL NLT Top-Line Chart Example

Now you understand how modern computer technology can help you as a trader to take meaningful decisions right from the chart: You trade what you see!
It is your system’s duty, help you find underlying changes in supply and demand, paint those on your charts, and give you market scanners that let you find those opportunities without the need for going through hundreds of charts. Our systems work on all time frames: Another example of AAPL on a monthly chart.
AAPL Monthly NLT Top-Line Chart
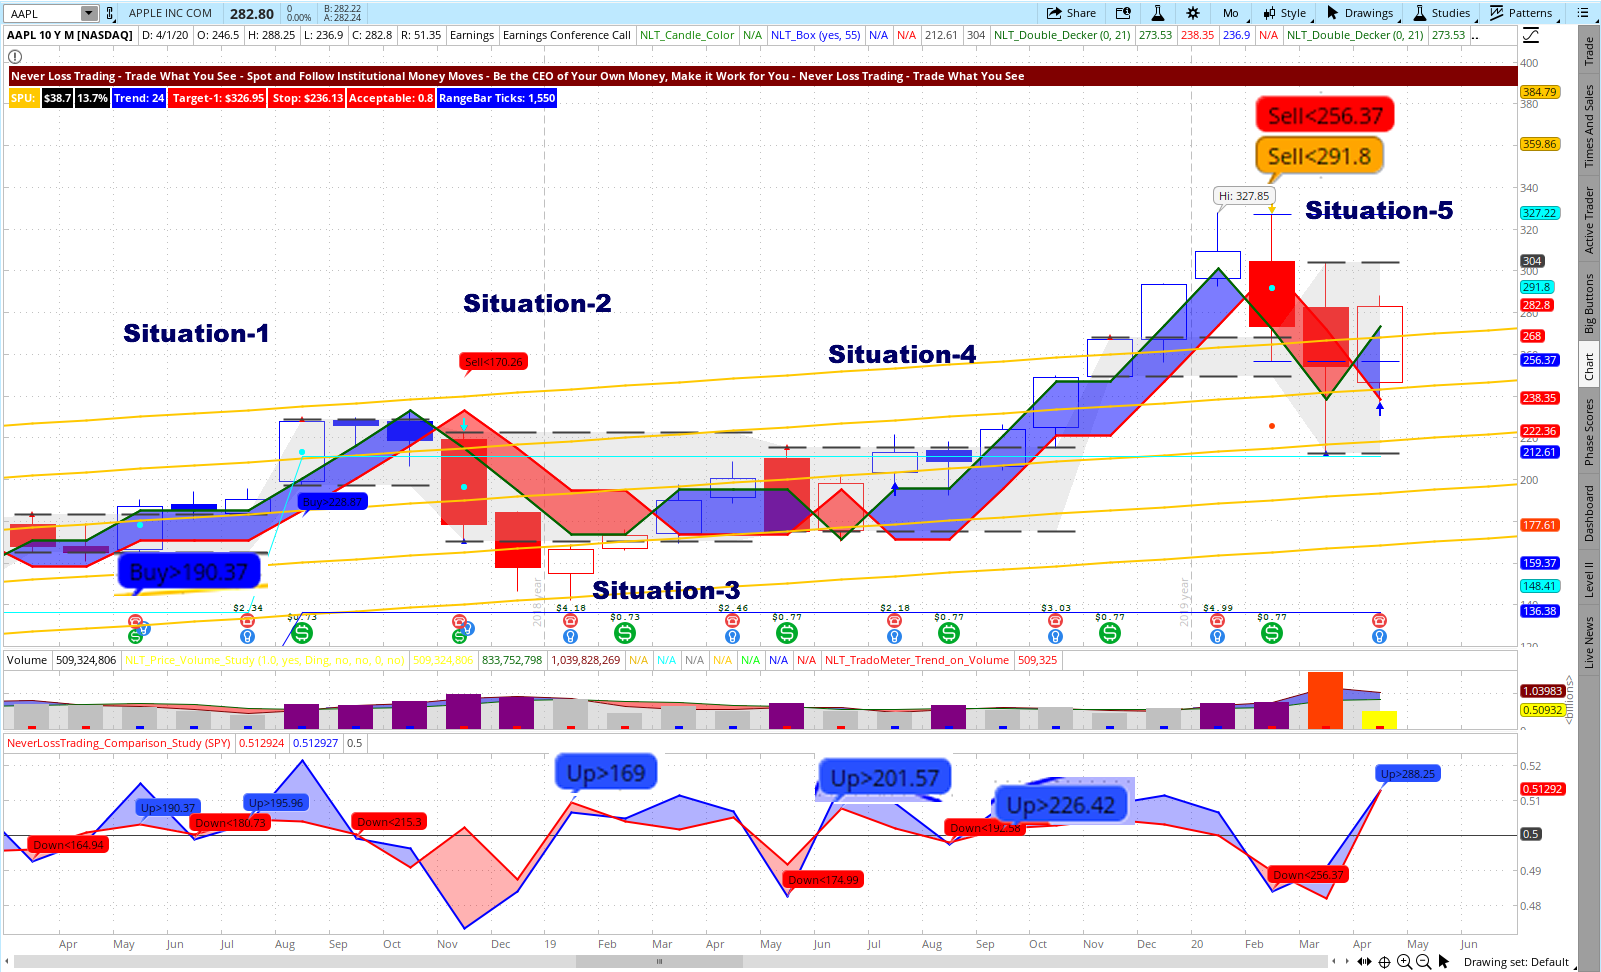
You see five highlighted situations that we analyze in detail for you.
| Situation | Actions |
| Situation-1 | Long trade by the price threshold: Buy > $190.37, being surpassed in the next candle. Trade for a maximum of five bars or to the price target. The trade started in an NLT Light Tower and ended there (candle with the cyan dot). |
| Situation-2 | No trade. The signal/direction is not supported by the lower study. |
| Situation-3 | Long trade for a maximum of five bars or exit at the NLT Box Line. |
| Situation-4 | Long trade for a maximum of five bars. |
| Situation-5 | Short trade to target. |
Our brand name derives from the concept of repairing a trade instead of accepting a stop loss; however, Never Stop Loss Trading was a bit lengthy.
TradeColors.com is our introductory system to high probability trading. We always allow for upgrades; you only pay the difference if you start with TradeColors.com and upgrade after.
TradeColors.com works by specifying potential trade situations by a two-candle color code: two of a kind and the high of two blue candles or the low of two red candles surpassed in the price movement of the next candle leads to a trade.
Let us share an example:
IWM on a Six Month Daily TradeColors.com Chart

The chart highlighted in orange trade situations confirmed by the next candle’s price move. In total, by following the system mechanically, eleven winning and two losing trades were achieved in six months.
From a return on investment perspective, you were looking at about 2.5% return on cash per instance with the same risk amount. This would have totaled up to 11 x 2.5% – 2 x 2.5% = 22.5% return in six month, not considering compounding interest. When we are not compounding interest
We included a new bottom indicator on the above chart and offer it as a year-end special for new subscribers.
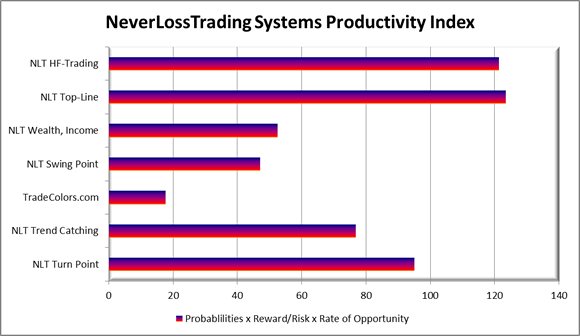
Many of our clients purchase more than one system: Our systems are productivity tools, and by combining them, you produce a higher participation rate and higher returns.
After demonstrating some swing- and longer-term trading examples on stocks, let us lead to Futures trading.
- Futures Trading Examples
If you are not considering futures trading by today, let us quickly give you in a short overview the advantages futures trading can provide you:

We hope this simple graphic explains why futures trading is essential as an investment vehicle. However, there is another dimension to it: You can protect your assets using futures contracts for overnight hedging, and we explain all this and more in our mentorships.
The E-Mini S&P 500 Contract is a forerunner of the S&P 500 index and trades around the clock six days a week. It is a leveraged product, and you only have to bring up a fraction of the margin to participate and trade the index. Let us show you a recent daily chart:
ES, NLT Daily Trend Catching Chart, Oct/Nov. 2021

From left to right:
- Sell < $4317.3, not confirmed in the price movement of the next candle, no trade.
- Floating Up, Buy > $4437.3, confirmed and came to target three candles after. By not entering at an exit candle, we neglect Buy C > $4517.5.
- Re-Entry at Floating Up, Buy C > $4543.3. Target reached three candles in the trade.
- Re-Entry at Floating Up, Buy C > $4603.5. Target reached after three candles in the trade.
- All other signals were not confirmed, and it is vital to stay out of a trade when no direction price pressure carries the trade to target. Therefore, we aim to produce income or a return, not to trade the trade.
Combining NLT Timeless and Time-Based signals increases your participation rate and investment opportunity for returns.
With the help of our systems, we help retail traders to decide at trade entry for five significant challenges to prevent the common mistakes:
- Trade entry decisions (when to trade)
- Exit decisions (where to take profit)
- Stops (where to place them)
- Maximum time in a trade (specified by the signal)
- Risk to reward (only trade at favorable setups)

With the NLT Timeless Concept, we introduced a new way of trading in 2021, and it can change your life as a trader, giving you unique entry and exit points, hard to predict for other market participants. We dissect time-based moves into price-based happenings with the NLT Timeless concept. Let me share a chart example:
E-Mini S&P 500 Futures Contract on December 1, 2021

The chart shows multiple trading opportunities, and you decide on those by rules we share with you in the mentorship. Those rules help you separate good from risky trades and provide one basis for our high probability setups. Let me give you an example:
In a short environment, the first leg wrong is wrong!
Explanation: When asset prices are dropping, you do not want to focus on a v-shape recovery; hence, you do not trade the first leg up, assuming it is just short-covering; however, you will trade the second leg up and act the same way on rising prices. Combining this pattern view with the indications you see on the chart paves your way to finding and working on high probability setups.
In the chart above, we shared nine winning trades, had you did not consider not trading the first leg, the trading day would have ended in nine winning (75%) and three losing trades (25%).
With the help of the NLT Timeless Concept, we cut the daily development into managerial portions with limited risk and defined expectations. Here is the referring daily chart:
E-Mini S&P 500 Futures Contract, October 15 to December 1, 2021

The chart includes our latest development: the NLT SPU Move Indicator, which is an addition to the NLT Systems. It works as a standalone and in conjunction with other NLT systems. As a year-end special, we offer to include this indicator for free if you sign up with us in 2021: a $3,997 value.
Experience how our systems work in a consulting hour:
contact@NeverLossTrading.com Subj.: Demo.
We are happy to hear back from you!
Disclaimer, Terms and Conditions, Privacy | Customer Support

No comments:
Post a Comment