
Trade with confidence in a sea of uncertainty!
Don’t fall for the illusion of winning at a 50:50 chance; institutions that take the other side of your trade are prepared for victory.
If you come prepared, you have an edge, but if not, your money will go quickly – and it takes more than one dimension of trading to consider, but it is learnable.
We are here to help and share what it takes as a day trader, swing trader, or longer-term investor.

Unleash the power of statistics: if your win rate is 40%, the odds of losing four times in a row shrink to just 13%.
Yet, sporadic wins won’t secure long-term success.
So, how do you shift the odds in your favor?
You need a decision-making model that propels you toward highly probable victories.
Ready to trade smarter, not harder?
Let’s redefine the game together, spelling out critical elements of trading success:
Critical Elements of Trading Success
| Critical Element | Explanation | Basis |
| Act on Price Turning Points | Initiation or Continuation Patterns | System |
| Charting Software | Make price moves visible and trade what you see | System |
| Increased Odds by Indicator Combinations | Combining trade-supporting indicators to reach probabilities of 65% to 70%. | System |
| Act on Confirmed Moves Only | System-specified price thresholds to operate with buy-stop or sell-stop orders | System |
| Price Move Margin | Price Span to bring the trade to the target | System |
| Exit Plan | System-defined at entry | System |
| Risk per Trade | Percentage-based risk scenario | Trading Plan |
| Number of Trades and Open Positions | Risk-based position sizing | Trading Plan |
| Trade Repair Concept | Repairing instead of accepting the loss | Trading Plan |
| Leveraging and Hedging | Combining stocks with options or using futures | Trading Plan |
| Minimum Return Expectation | Reward/Risk Scenario | Trading Plan |
| Trade Finder | Identifying price move potentials | System or Subscription |
Price Turning Point: System-Driven Insights
Identify initiation or continuation patterns through a robust system that navigates market complexities. Price change results from a change in supply and demand. Key asset holders will re-balance their inventories by flooding or shorting supply at a particular price expansion. Hence, price moves will not last forever, and your system must alert you when a crucial price move starts and where it probably ends. This is where a combination of indicators shall help you to repetitively make solid trading decisions when the odds are in your favor.
Charting Software: Illuminating Price Moves
Utilize advanced charting tools that go beyond the surface, making price moves visible for informed decision-making.
Combining trade-supporting indicators to achieve probabilities of 65% to 70% creates a comprehensive trading strategy.
SPY Daily Chart, NLT Systems Combined

The captivating chart above unveils the SPY’s daily intricacies, intricately woven together by the prowess of various NLT Systems:
- The insightful NLT Top-Line
- The astute NLT Price Move Indicator
- The nuanced NLT Seasonality Price Move Indicator
- The commanding NLT Swing Power Indicator.
As the market danced at critical junctures, the NLT Indicators deftly illuminated price thresholds, beckoning decisive action such as a persistent “Sell” signal once the price dipped below the $429.09 mark. Picture executing a sell-stop order at $439.02, initiating a foray into the short side – a maneuver executed by either selling the stock outright or deploying a strategic options trading approach. Enter the realm of the NLT Delta Force Concept. This beacon dictates the precise options strike price, the reasonable maximum premium to expend or minimum to accumulate, the optimal expiration timeframe, and the unwavering minimum return expectation.
This seemingly intricate concept serves as a beacon, unraveling the complexities of options trading. Envision possessing such prescient directional cues, guiding your strategic dance through the market’s labyrinth. What transformative impact could this have on your trading prowess?
The following chart shows NFLX, and with the help of the red line on the blue or red frame, you could trail the price move up and down.
NFLX, Daily Chart, NLT Systems Combined

The chart shows six critical price turning points that reached their system-set target (dot). At entry, our systems define the exit and price adjustment levels.
Why price adjustment?
We teach trade repair instead of accepting the stop, which gave us our brand name, but Never Stop Loss Trading was lengthy.
We can add endless examples but offer you to experience with us in a life session how our systems work for day trading, swing trading, and longer-term investing.
contact@NeverLossTrading.com Subj.: Demo
Aside from the pure chart analysis, there are other dimensions to consider for being prepared to achieve long-term trading success, and we like to go through them with you:
Price Move Margin: Maximizing Trade Potential
Determine the required price span to reach your trade target with a strategic approach to optimizing potential gains. However, this is easier said than done.
Let us explain how our price move model and the resulting systems support you in giving the trade the appropriate wiggle room to reach the target instead of being constantly stopped.
A Glimpse of NLT Analytics
To invite you into our way of thinking and acting:
“Letting the chart tell when to buy or sell.”
We best start with the market model we use and follow:
Adaptive model that follows the action of exchanges: Many systems follow a stringent mathematical correlation like the 1, 2, and 3 wave follows the A, B, and C wave; however, the actual happening between supply and demand is not predictable by predefined repetitive cycles. There is an underlying structure, but it is not expressible in repetitive cycles but rather in fractals. Let us invite you to a short intro into the mathematical world of fractals: Benoit B. Mandelbrot, MIT 2001 – Fractals in Science, Engineering and Finance (Roughness and Beauty). This video expresses the basis of our calculation models, and you do not need to worry about replicating this to start trading; we did it for you. The natural happening of an exchange needs a model on which to base algorithms and assumptions.
NeverLossTrading Price Move Model
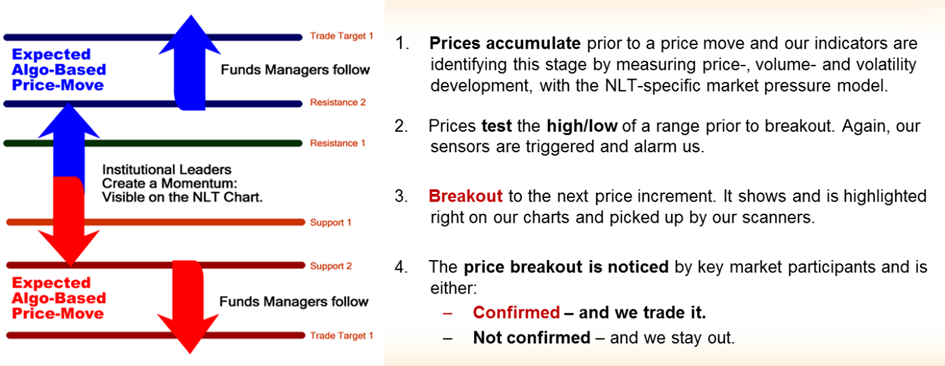
Hence, we only open a transaction when other market participants confirm the new direction through buying or selling, driving the price past the system-set threshold. Our system specifies the positive exit with the entry condition, calculating “SPU” (Speed Unit) and such, defining the price move from entry to target to relate it in the second step to the system set stop, and we will explain how we calculate this component.
Definition of NLT SPU

After defining two variables, we must specify the stop or trade adjustment level.
What is a trade adjustment level?
It is the price to put the stop; however, instead of closing the trade at the stop price level, you adjust or add to the trade, repairing the trade instead of accepting a complete loss. The idea of Never Stop Loss Trading gave us our brand name, but we shortened it a little.
So where to place the stop?
According to our research, a risk-to-reward ratio of 1.2 concerning is beneficial for several reasons:
- Compensating for Uncertainty: There’s always a degree of uncertainty in trading. By employing a risk-to-reward ratio of 1.2, you provide a buffer that compensates for potential unexpected price movements or market volatility. This buffer helps account for the natural unpredictability of the financial markets.
- Improved Win Rate: A risk-to-reward ratio of 1.2 can contribute to an increased win rate. When the potential reward is slightly higher than the risk, successful trades impact your overall profitability more. Therefore, the favorable risk-to-reward ratio can help generate consistent profits even if your win rate is not extraordinarily high.
- Balancing Risk and Reward: Using a risk-to-reward ratio of 1.2 ensures that your potential reward is proportionate to the risk taken. In addition, it establishes a balanced approach to trading, where you aim to maximize your gains while managing and limiting potential losses.
- Long-Term Profitability: A risk-to-reward ratio of 1.2 can contribute to sustainable profitability over the long term. Maintaining a balanced risk-reward profile creates a solid foundation for your trading strategy, promoting consistent returns and minimizing the impact of occasional losses.
You might think that a 1.2 times risk to reward is unfavorable; however, calculate with an average winning percentage of 70%. For example, when you aim to gain $250, you risk $300. Quantifying the equation with probability, the expectation value of this setup is $250 x 0.7 – $300 x 0.3 = $85. However, if you work with a narrow stop, you only win 20% of the time; for the rest, you get stopped, and the equation calculates as follows: $250 x 0.2 – $100 x 0.8 = -30, producing a negative expectation value with no chance of making money long-term.
Statistical distribution of data is essential to make sound decisions; however, we always deal with uncertainty and will never be 100% right. Hence, risk management and money management are critical components to learn, and we teach those one-on-one in our training and coaching sessions, focusing on your specific financial goals and time available for trading. Solid decision-making is based on replicating the market in a proven model, and we integrate all that we shared above into our indicators and summarize the underlying decision-making basis as follows:
Algorithmic and AI Components in NeverLossTrading
| Core Components | Integrated in NLT | Not Integrated |
| Adaptation to actual, not relying on fixed patterns or algos | Yes | |
| Complex non-linear decision making | Yes | |
| Considering actual news and social data | Partially | |
| Real-time strategy adjustment | Yes | |
| Forecasting capability | Yes | |
| Rule-based trading | Yes | |
| Quantitative analysis and synthesis | Yes |
Adaptation to Actual

All our indicators include a component of machine learning to analyze vast amounts of data, constantly adjusting to actual and not relying on fixed forecasting models. Our indicators include seismic readings, measuring market vibrations, and pre-stages of a likely price breakout move.
Complex Decision-Making
Our systems and indicators can make complex, non-linear predictions. They can process unstructured data to forecast critical price turning points to extrapolate entry, exit, and stop rules.
Considering Actual News and Social Data
We have not found value in using natural language processing and sentiment analysis tools to gauge public sentiment from news articles, social media, and forums and forecast price movement with high probability. By assuming that the crowd follows the leaders, we only consider what the leaders are doing to stay ahead of the crowd, which helps us get our price moves to target. Hence, we consider economic news and corporate events but not what people say on social media.
Real-Time Strategy Adjustment
Our systems and indicators adapt to changing market conditions, and we teach you to adjust strategies accordingly, staying the captain of your financial future.
Forecasting Capabilities
Our systems can predict future market movements with high probability, identify trends, and even recognize patterns not apparent to human traders.
Rule-Based Trading
Algorithmic trading relies on predefined rules and instructions, helping you to act prepared when specific setups occur on your charts. These rules determine when to buy or sell assets based on specific conditions and parameters with split-second precision.
Quantitative Analysis and Synthesis
As listed under the headline: “Input Components to Extrapolate Price Moves,” our systems analyze data from price change and reach to order flow.
In summary, you now know the components we consider for identifying highly probable chart setups to follow.
The visionary behind NeverLossTrading is Thomas Barmann; since 2008, he has harnessed the predictive potential of Algorithmic Trading and AI, aiming to let private investors participate in the financial markets with an edge.
Unveiling Analytical Evolution
Algorithmic and AI trading as a marvel is poised to revolutionize how traders and investors approach financial markets. What sets NLT analytics apart is its remarkable ability to provide highly accurate market forecasts at or above 70%. Those who heed the insights could see substantial growth in their investment portfolios.
What is your take away:
- Let your system spell out price turning points and how far they shall reach, applying mechanical rules rather than leaving room for interpretation.
- Price Moves are system-specified by direction and time
- To ensure that other market participants have the same directional assumption, we are entering orders above/below the system-specified price threshold.
Further System Requirements
Aside from the model following the natural action of changes in supply and demand, we formulated three further requirements:
- High-Probability Turning Points: A systematic approach to identifying high-probability price turning points through fact-based analysis, utilizing systems, scanners, and alerts, is essential.
- Price Movement Identification: Defining a price move’s beginning and likely end with precision, facilitated by a robust trading system, is crucial for strategic entry and exit.
- Stringent Entry and Exit: A systematic approach to entering and exiting trades based on well-defined conditions enhances consistency and minimizes emotional decision-making.
Exit Plan: System-Defined Precision
Craft a well-defined exit plan at the entry point, relying on systematic parameters to secure profits or mitigate losses.
Risk per Trade: Percentage-Based Prudence
Adhere to a percentage-based risk scenario for each trade, guided by a meticulously crafted trading plan.
Number of Trades and Open Positions: Strategic Allocation
Manage the share of total trades and open positions according to a trading plan that allocates resources judiciously.
Trade Repair Concept: Adaptive Responses
Repair trades instead of accepting losses with a resilient trading plan that adjusts to market dynamics.
Leveraging and Hedging: Strategic Diversification
Employ combinations of stocks with options or utilize futures, adapting to various market scenarios.
Minimum Return Expectation: Reward/Risk Scenarios
Establish minimum expectations for returns relative to risk, following a well-defined trading plan with desired risk-reward ratios.
Trade Finder: Identifying Potentials
Identify potential trades based on system or subscription insights, leveraging advanced tools to sift through myriad opportunities.

We invite you to a free week of NLT Stock Alerts:
contact@NeverLossTrading.com Subj.: Free Stock Alerts
No credit card required; no strings attached.
How do our indications make a difference?
We measure the market’s pulse by analyzing underlying supply and demand changes. Price moves have an intro, and our algorithms pick the indication, spell out entry and exit conditions, and always stay in real-time with the observed asset’s price movement.
We have over ten years in the trading education business and have helped many make fruitful financial decisions. We work one-on-one only. In our yearend special, we integrate the new indicator into our systems for a marginal extra.
To succeed in trading, you best work with an experienced coach and learn much about trading. Our #1 competitive advantage is the support and customer service we offer. We work one-on-one with you to specify what we teach to your specific wants and needs; hence, if your knowledge base is not expanding rapidly, you are doing something wrong.
Ongoing education and mentoring are crucial to longevity in this business. Veteran traders have been through more ups and downs than you can imagine. So, experienced pros have probably experienced whatever you’re going through.
If you are ready to make a difference in your trading:
contact@NeverLossTrading.com Subj.: Consultation
It takes multiple dimensions to turn yourself into the trader or investor you want to be, and we support you in acquiring the knowledge and skills needed.

Trading is not a typical career, and you best learn from those who are long-term in this business to cope with the rollercoaster of the financial markets. We are here to help and provide feedback on what you might be doing right or wrong.
The markets changed, and if you do not change your trading strategies with them, it can be a very costly undertaking.
We are looking forward to hearing back from you,
Thomas Barmann (inventor and founder of NeverLossTrading)
Disclaimer, Terms and Conditions, Privacy | Customer Support

No comments:
Post a Comment