
Institutional investment firms are pivotal in shaping trends and influencing market movements. Armed with vast resources and sophisticated strategies, these behemoths meticulously analyze financial market happenings to make informed investment decisions. This essay explores the methods employed by big institutional investment firms in deciphering weekly events and how NeverLossTrading (NLT) indicators help traders and investors follow their actions.
NeverLossTrading is not a vow of infallibility in trading; instead, it embodies the art of seizing high-probability price turning points, aiming for consistent income by skillfully averting drawdowns.

Decoding the Happening
Institutional investment firms, often managing massive portfolios for clients and stakeholders, navigate a complex web of information to discern trends and opportunities. One crucial aspect of their decision-making process involves staying attuned to daily and weekly happenings that can impact financial markets. This includes monitoring economic indicators, geopolitical developments, corporate earnings reports, and other relevant asset value news.
These institutions leverage quantitative analysis, fundamental research, and proprietary algorithms to process vast data. Fundamental analysis involves scrutinizing the financial health of companies and assessing macroeconomic factors, while quantitative models use mathematical algorithms to identify patterns and correlations in market data. Institutional investors aim to gain a competitive edge by carefully dissecting weekly events through these lenses.
The Role of NLT Indicators
NeverLossTrading indicators have become invaluable tools for traders and investors seeking to understand and follow the actions of institutional investment firms. The name NeverLossTrading derives from the concept of repairing trades instead of accepting the stop loss. NLT focuses on identifying shifts in market leadership, emphasizing the importance of recognizing emerging trends and adapting investment strategies accordingly. The theory posits that new market leaders, whether sectors, industries, or individual stocks, can provide valuable signals for investors.
Institutional investment firms often leave discernible footprints in the market, influencing the trajectory of specific assets or sectors. NLT indicators help investors track these shifts in leadership. For instance, institutional accumulation or distribution of particular stocks can be identified through volume analysis, aiding traders in making timely and informed decisions.
| NLT Indicator | Color | Basis | Probability |
| NLT TOP Line Power Tower NLT Price Move Indicator | Red/Blue | At handover points, where buyers take over from sellers and vice versa, at initiation and trend continuation | 72% |
| NLT End of Purple Zone Signals | Purple | After times of ambiguity, when a new direction is found | 68% |
| NLT Swing Power Signal | Yellow | When a new direction is found after increased exchange activity without a directional move | 68% |
| NLT Reversal Indicator | Green_R, Green_X | At the end of a trend. | 65% |
By integrating NLT indicators into their analysis, investors can gauge the strength of prevailing trends and identify potential reversals. Recognizing when institutional players are actively entering or exiting positions allows for a more strategic approach to portfolio management.
Always consider: Investing in your knowledge and skills yields the highest long-term return, and we are here to share ways of acting when it matters and always keeping capital preservation as your core goal, aside from producing a return on investment.
Conclusion
In conclusion, big institutional investment firms employ sophisticated strategies to decode weekly happenings and make well-informed investment decisions. The integration of NLT indicators into the analysis process enhances the ability of traders and investors to follow the actions of these institutional giants. By understanding the methodologies used by these firms and leveraging NLT insights, market participants can navigate the complexities of financial markets and position themselves for success in an ever-evolving landscape.
Examples
Our first example analyzes the stock market based on the E-Mini S&P 500 Futures contract development between March 2023 and January 2024.
E-Mini S&P 500 Futures with NLT Top-Line and SwingPower

On the chart, we highlighted seven situations and will explain how to read and act on them:
- Situation-1, highlights an NLT Purple Zone, reflecting ambiguity in the price direction, and as such, we do not accept signals in this zone. At the end of the zone, we take a directional trade if a signal occurs.
- Buying> $4227.25 indicated a potential for going long in the underlying contract when the price move of the next candle surpasses this price threshold. This fact led to a trade to the upside with an exit at the purple dot on the chart.
- The following two buy signals were unconfirmed, and no trade was conducted.
- Signal-5 came in an NLT Purple Zone, and we did not trade it.
- Signal-6, Buy > $4319.80, was confirmed and led to an upside trade to the second blue dot on the chart, where we took the exit, assuming a pullback.
- Signal-7 confirmed the upside price move to the second blue dot on the chart.
As you can see, we trade by clearly defined rules, letting the chart tell us when to buy or sell.
Let us pick a widely liked stock and do the same type of analysis to find crucial price turning points:
AAPL, Weekly NLT Top-Line and SwingPower Chart
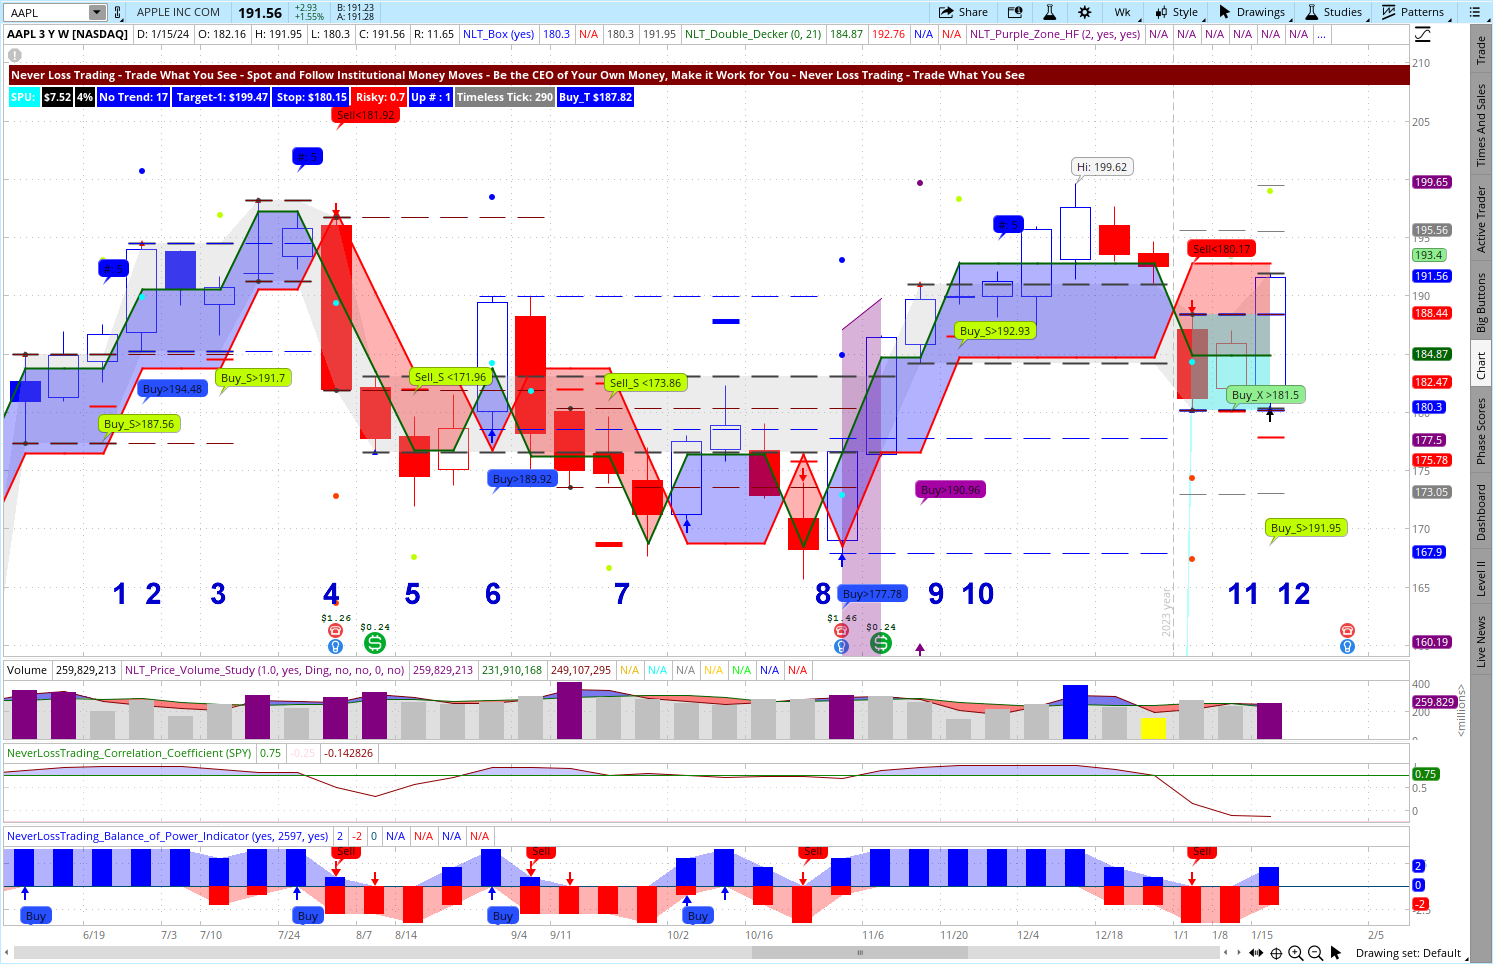
The chart shows the period from March 2023 to January 2024, with multiple trade indications.
Signal-1: Buy > $187.56, confirmed in the next candle and lead to a price move to target. The following blue buy signal did not confirm at first, but secondly, we will never enter at the exit candle (one of our rules).
Signal-3: Buy > $191.70 confirmed and came to target (dot on the chart).
Signal-4: Sell < $181.92 confirmed, with a short cover at target (red dot). The following signals, 5 and 6, were not confirmed, and no trade was conducted.
Signal-7: Sell < $173.86 confirmed, and even so, it was challenged after three candles in the price move never came to the stop-level (red crossbar of the trade initiation candle) and then came to target.
The signals 8, 9,10, and 11 lead to a trade that came to the system-defined target.
We picked another popular stock and highlighted trade situations and conclusions for TSLA. The chart shows eight trade potentials we will discuss.
TSLA, Weekly NLT Top-Line and SwingPower Chart
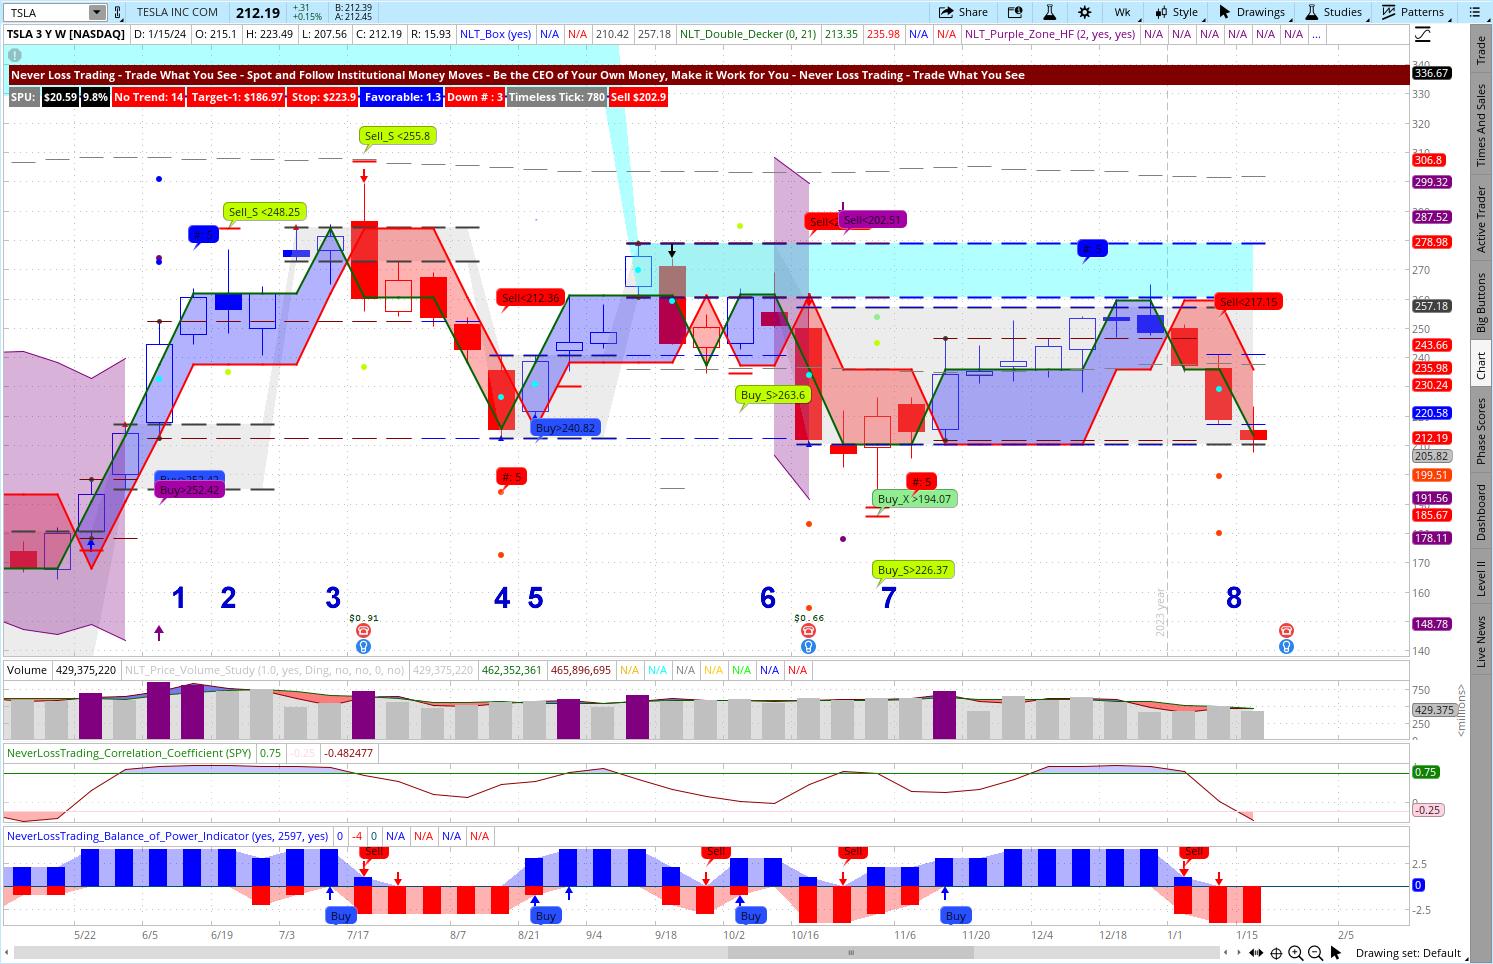
Chart Analysis
Signal-1 led to an upside trade to target (dot on the chart). Two independent indicators announced the long trading opportunity, and the next candle’s price move confirmed the trade.
Signal-2 did not lead to a trade because we did not enter at the exit candle (same rule as explained in the AAPL example).
Signal-3: Sell < $255.80 initiated a short trade to target.
Signal-4: The red sell signal was not confirmed, and we will only trade this signal on candle number one or two of an NLT series.
Signal-5: Buy > $240.82 confirmed and came to target.
Signal-6: Sell < $263.60 got stopped, and we did not enter the signals on the level of the exit candle of this trade.
Signal-7 worked, and the trade came to the system-set target.
Signal-8, did not lead to a trade because the NLT Box Line cut the price move to target short.
There are rules to learn, and we work individually with our students on their best available days and times to teach them how to read and follow NLT Signals by letting the chart tell them when to buy or sell: Trade what you see!
If this inspires you to make high-probability trading decisions, email us, and we will get together online to find out which of our systems or system combinations suit you best.
contact@NeverLossTrading.com Subj.: Consulting
Let us add another weekly analysis showcasing the bond market by the 30-year Bond Futures, which have been in a consistent uptrend since October 2023.
NLT charts serve as a sophisticated tapestry woven from multiple NLT Systems, offering a mosaic of buy and sell indications. The star of this final visual symphony is the underlying 30-year Bond Futures contract, a realm where precision and insight reign supreme.
In 30-year Bond Futures, every move is a dance of seconds, where price changes are measured in increments known as ‘seconds,’ each tick reflecting a shift of $31.25 in the underlying contract price. Our charts transform this granularity into a metric scale, prorating incremental changes for clarity.
30-Year Bond Futures on a Multisystem NLT Chart

Check if you feel confident following what you see on the chart. Take, for example, the Sell_S signal at <$118.44, denoted by the second yellow signal from the left. This indicator serves as a gateway to potential trades, suggesting an opportunity if the price in the upcoming week descends below 118’14. The intricacies don’t stop there; the trade’s destination is marked by the yellow chart dot at 115’29, guarded by a stop at the red crossbar at 122’11. Again, trade what you see and follow high-probability system setups with clearly defined rules.
We could continue adding chart examples but offer you the opportunity to see how our indicators perform live in an online session, where we jointly find out which of our systems or system combinations suit you best.
contact@NeverLossTrading.com Subj.: Consulting
We have a special package deal ready for you (NLTFeb24), giving you substantial savings for the seen charting package.
How do our indications make a difference?
We measure the market’s pulse by analyzing underlying supply and demand changes. Price moves have an intro, and our algorithms pick the indication, spell out entry and exit conditions, and always stay in real-time with the observed asset’s price movement.
We have over ten years in the trading education business and have helped many make fruitful financial decisions. We work one-on-one only. In our yearend special, we integrate the new indicator into our systems for a marginal extra.
To succeed in trading, you best work with an experienced coach and learn much about trading. Our #1 competitive advantage is the support and customer service we offer. We work one-on-one with you to specify what we teach to your specific wants and needs; hence, if your knowledge base is not expanding rapidly, you are doing something wrong.
Ongoing education and mentoring are crucial to longevity in this business. Veteran traders have been through more ups and downs than you can imagine. So, experienced pros have probably experienced whatever you’re going through.
If you are ready to make a difference in your trading:
contact@NeverLossTrading.com Subj.: Consultation
It takes multiple dimensions to turn yourself into the trader or investor you want to be, and we support you in acquiring the knowledge and skills needed.
Sign up for our trading tips and publications.
Trading is not a typical career, and you best learn from those who are long-term in this business to cope with the rollercoaster of the financial markets. We are here to help and provide feedback on what you might be doing right or wrong.
The markets changed, and if you do not change your trading strategies with them, it can be a very costly undertaking.
Thomas Barmann (inventor and founder of NeverLossTrading)
Disclaimer, Terms and Conditions, Privacy | Customer Support

No comments:
Post a Comment