
Private investors make critical decisions in less time than ever in today’s investment landscape. On average, traders decide to enter or exit an investment in less than two minutes. Rather than lamenting this fact, we acknowledge it and empower our traders/investors to make informed, fact-based decisions within this brief window.

Let’s delve into how NLT Investors can navigate swing trading and longer-term investing decisions efficiently and effectively:
NLT Alerts

Our NLT Alerts serve as invaluable tools for investors, providing timely notifications of market developments and opportunities. These alerts are meticulously curated to ensure relevance and accuracy, enabling investors to stay ahead of the curve and make swift decisions with confidence with asset focus on:
- Stocks
- Futures
- FOREX
Experience the power of our comprehensive market analysis firsthand! We meticulously monitor daily, weekly, and four-hour signals, providing our subscribers with a comprehensive overview of market dynamics. Our daily summaries offer concise insights into key developments, complemented by detailed analyses to guide informed decision-making.
As a gesture of confidence in the value we provide, we invite you to receive our daily stock alert summary free for a week. Take advantage of this opportunity to assess the depth and quality of our insights, and discover firsthand how our analysis can enhance your trading strategy.
contact@NeverLossTrading.com Subj.: Stock Alerts
For traders engaged in Futures or FOREX markets, we provide a comprehensive summary tailored to your specific needs. However, we understand the importance of clarity in interpreting our alerts, which is why we offer additional interaction to ensure you fully grasp our methodology.
Our goal is to empower traders to seize opportunities at crucial price turning points, equipped with pre-defined entry thresholds, exits, and stops. By engaging with us further, you’ll gain invaluable insights into how to leverage our alerts effectively, maximizing your potential for success in these dynamic markets.
Navigating investment decisions solely from a table can be a daunting task. At the core of our methodology lies a fundamental principle: “trade what you see, let the chart tell when to buy or sell.” In line with this ethos, we equip our clients with sophisticated charting software, a vital tool that empowers them to make informed decisions with confidence and clarity.
Charting Software
Harnessing the power of advanced charting software, our investors allow the chart to dictate when to buy or sell. By analyzing key indicators and price movements, investors can precisely identify optimal entry and exit points, all within a few minutes.
Trade what you see: Let the chart tell when to buy or sell!
Weekly Charts for Longer-Term Investing
We employ weekly charts as our primary analytical tool to manage positions over multiple weeks or months. Within the following chart example, we utilize NLT Top-Line and NLT Swing Power signals to inform our decision-making process. Additionally, we rely on visual indicators such as dots, which delineate potential exit points based on our analysis. Furthermore, the red line of the NLT Double Decker serves as a dynamic trailing stop line, helping safeguard profits and manage risk effectively throughout the trade.
The yellow indicator on the price chart is the newly launched NLT SwingPower indicator. To explain what it does, we are happy to send you a PDF write-up.
contact@NeverLossTrading.com Subj.: SwingPower PDF
SPY October 2023 to February 2024, Weekly Development

We had four trade indications: blue from NLT Top-Line and yellow from NLT Swing Power, which we will now discuss in detail to share how we select following or not following chart indications.
| # | Indicator |
| 1 | NLT Top-Line Buy > $436.29, confirmed with a target at the second dot, where we anticipate a slight pullback and exit. This signal was expected to come to the second dot in a maximum of ten candles, which it did. |
| 2 | NLT SwingPower Buy > $451.52 came to the system-set target. If you operated with both systems, then it would be a directional trad confirming indicator. |
| 3 | NLT Top-Line Buy > $436.29, confirmed with a target at the second dot, where we anticipate a slight pullback and exit. This signal was expected to come to the second dot in a maximum of ten candles, which it did. |
| 4 | NLT SwingPower Buy > $451.52 came to the system-set target. If you operated with both systems, then it would be a directional trad confirming indicator. |
It’s good to see how the NLT systems performed on the way up, but how did they support solid decisions on the way down?
SPY October 2023 to February 2024, Weekly Development

We picked the period of January to September 2023 and will discuss the individual signals of the system performance, discussing nine trade indications.
| # | Indicator | Result |
| 1 | Double Sell signal that came to the system set target. | worked |
| 2 | Additional sell signal on the way to target that we neglect (Buy < $437.95, buy not entering a new signal at the exit candle: a simple rule to learn. | no trade |
| 3 | Buy_S> $437.84 that came to the system set target (dot on the chart). | worked |
| 4/5 | Two additional buy signals are on the way to target, which we neglect. | no trade |
| 6 | NLT End of Purple Zone sell signal that reached its target. | worked |
| 7 | NLT Top-Line Buy signal that failed. | failed |
| 8 | The yellow sell signal came to the target. | worked |
| 9 | Orange NLT Top-Line Signal that worked. | worked |
| 10 | Directional confirming yellow buys signal we neglect on the way to target | no trade |
| 11 | NLT Top-Line sell signal that reached its target | worked |
| 12 | NLT Top-Line sell signal that reached its target | worked |
Eight trading opportunities where seven worked, and one failed: this is what we call high probability trading.
Swing Trading Example
Our swing trading signals typically span from one to ten days, contingent upon fulfilling predetermined price thresholds with each new candle. This meticulous approach ensures that trades are only initiated when specific criteria align with our system’s parameters, thereby enhancing the probability of success.
In individual stock trading, we recognize the heightened price pressure exhibited compared to broader stock market indices when there is a discernible shift in supply or demand dynamics. This understanding underscores the importance of precision in identifying and responding to such market movements.
To provide further clarity on the efficacy of our trading systems in navigating complex scenarios, we present a comparative analysis of short and long positions in the SPY, offering insights into their performance under varying market conditions. If you find value in leveraging high-probability systems to inform your trading decisions, we cordially invite you to participate in an online demo. During this session, you will have the opportunity to select stocks, commodities, or FOREX pairs of interest, and together, we will evaluate the outcomes of both successful and unsuccessful trades, allowing you to gauge the effectiveness of our approach firsthand.
contact@NeverLossTrading.com Subj.: Demo
SPY September to November 2023

The chart shows ten price move indications we evaluate and discuss for your understanding.
| # | Indicator | Result |
| 1 | Red NLT Top-Line Sell signal, confirmed and came to target. | worked |
| 2 | Yellow buy signal, we neglected on the way to the target of the first signal. | no trade |
| 3 | Red NLT Top-Line Sell signal, confirmed and came to target. | worked |
| 4 | Yellow buy signal, we neglected on the way to the target of the prior signal. | no trade |
| 5 | Yellow buy signal that worked. | worked |
| 6 | Yellow buy signal, not confirmed in the price movement to the next candle. | no trade |
| 7 | Red NLT Sell Signal, confirmed. | worked |
| 8 | We neglect the yellow buy signal because the blue channel border cuts the price movement to target short. | no trade |
| 9 | Two independent buy signals came to target. | worked |
| 10 | Buy signal that came to target. | worked |
Our approach systematically adheres to predefined rules, ensuring that trades are not executed mechanically at every price movement indication. Instead, we exercise discretion and selectivity, only entering trades when the subsequent candle’s price movement exceeds the established system-set threshold.
In our personalized one-on-one coaching sessions, we provide comprehensive guidance and mentorship over several months. Through this intensive program, we equip you with the knowledge and skills to make informed decisions based on NLT indications. By allowing the chart to dictate optimal entry and exit points, we empower you to navigate the markets with confidence and precision.
To underscore the integrity of our methodology and dispel any notion of cherry-picking favorable periods, we deliberately select the most current price indications for SPY from a daily chart when composing this article. This deliberate approach provides an accurate and unbiased representation of our system’s performance, showcasing its efficacy across market conditions.
SPY January and February 2023

| # | Indicator | Result |
| 1 | Blue NLT Top-Line buy signal was confirmed and came to target. | worked |
| 2 | Yellow buy signal, we neglected on the way to the target of the first signal. | no trade |
| 3 | Red NLT Top-Line sell signal not confirmed. | no trade |
| 4 | Yellow buy signal, confirmed. | worked |
| 5 | Red NLT sell signal not confirmed. | no trade |
| 6 | Blue NLT buy signal confirmed. | worked |
| 7 | We neglected the yellow buy signal on the way to the target of the blue signal while it was confirmed and worked in itself. | no trade |
We could undoubtedly add example over example, but if you are interested in working with our systems, we offer you a free demo:
contact@NeverLossTrading.com Subj.: Demo
Day Trading Examples
NeverLossTrading provides a solid foundation for day trading, ensuring that students, regardless of their experience level, clearly understand market dynamics and order types by acting at crucial price turning points. In addition to conventional time-based day trading strategies, we have pioneered the NLT Timeless Concept, which operates based on system-specified price increment changes. Within our timeless day trading framework, we integrate multiple systems to optimize accuracy and effectiveness. Nevertheless, it is crucial to emphasize that our trading approach is inherently probabilistic. While we strive for precision, we acknowledge that no trade outcome can be guaranteed with absolute certainty.
NLT Timeless Day Trading Chart
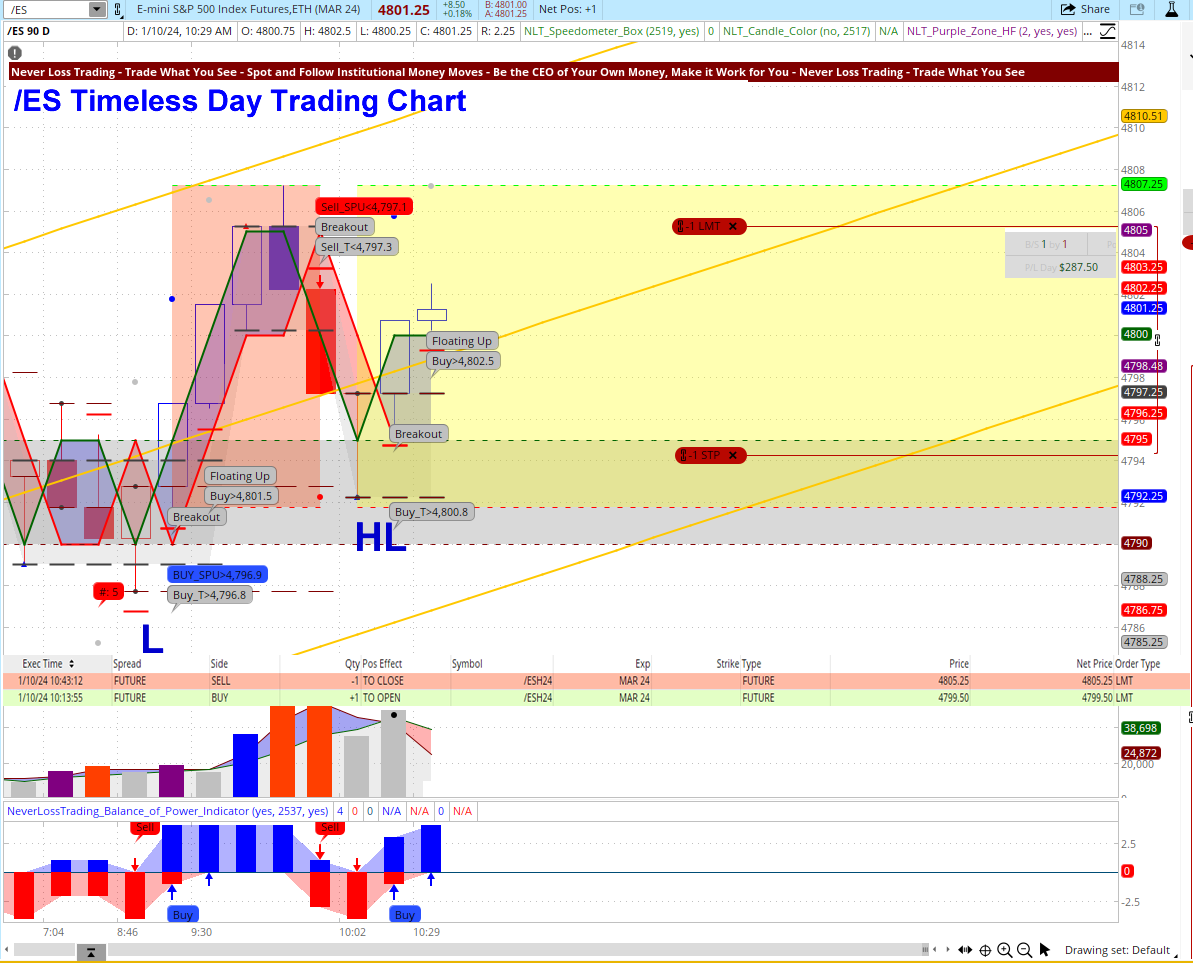
In the above chart, we highlighted four potential trade situations:
- The first two trade indications occurred in what we call an NLT Purple Zone (indication of directional price ambiguity), and we do not trade as long as zones of price ambiguity hold.
- In Situation-3, the NLT Purple Zone ended in a long signal: Buy > $4,789. The target for the trade was at the dot of the chart and the stop at the bottom of the indication candle.
- Situation-4 offered a short opportunity at a strong signal, NLT PowerTower Down, Sell < $4787.50, combined with an NLT Breakout signal. Knowing from the NLT Dashboard where to enter, we placed a sell-stop order, which did not immediately fill but continued the price move and came to target (dot on the chart).
NLT Day Trading Chart Example
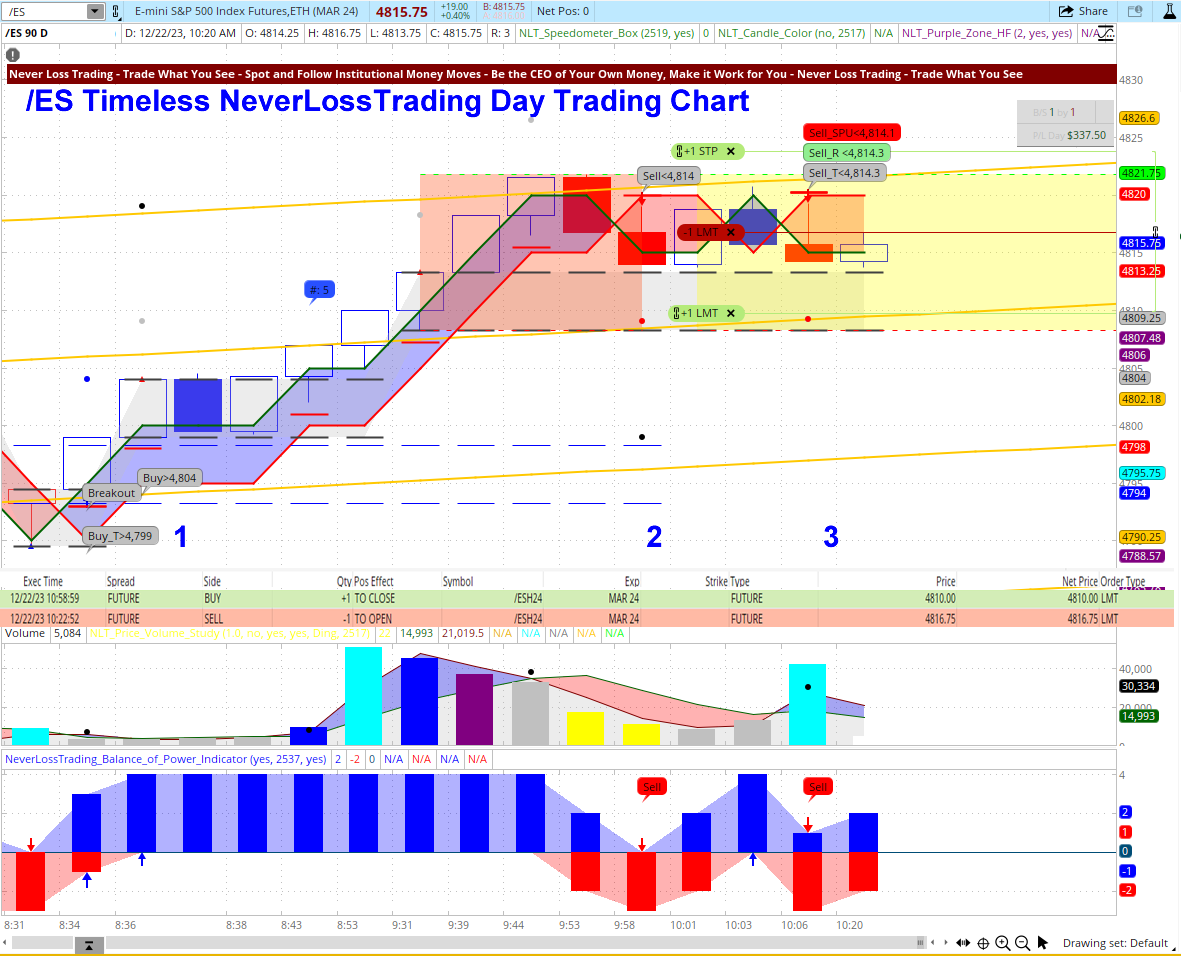
From the left to the right, we highlighted three trade potentials:
- Situation-1: Long opportunity, expressed by two buy signals. The upward price move is trailable by the red line of the blue frame that follows the price momentum.
- Situation-2 did not lead to a trade because a black dashed line cut the potential price movement to target short, and we spared the trade.
- Situation-3: A short trade with a bracket order developed, came to target, and produced $337.50 per contract.
If this is for you, we are happy to demonstrate how our systems work in real time:
contact@NeverLossTrading.com Subj.: Demo
In conclusion, while investment decision-making may accelerate, NLT Investors are equipped with the tools and strategies needed to thrive in this dynamic environment. By leveraging NLT Alerts, advanced charting software, trade repair strategies, and a combination of daily and weekly charts, investors can make informed decisions within two minutes and confidently seize opportunities.
Are you ready for a solid basis for quick trading and investing decisions?
We teach and coach one-on-one, and spots are limited.
Thomas Barmann (inventor and founder of NeverLossTrading)
Disclaimer, Terms and Conditions, Privacy | Customer Support

No comments:
Post a Comment