
Market timing means buying and selling at the right price: This is exactly the business all institutional investors are in and why the financial markets progress in alternating prices.
Let us put this in action terms: You focus on a specific price at which you enter the market and pre-define where you want to exit.
If you feel, you are not yet predicting market prices or market timing to your satisfaction; you might want to consider using a system, which gives you high probability trade setups with defined entry and exit prices.
NeverLossTrading Top-Line Chart, SPY – Daily - November 9 – December 8, 2015
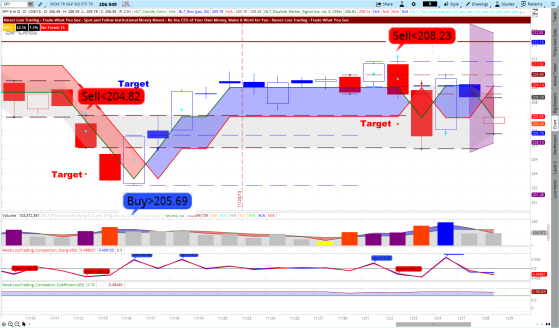
The above chart shows how our algorithmic-, activity based trading system defines price thresholds like Buy>$205.69; when this price threshold is surpassed in the next candle, we enter a trade with a buy-stop order and exit at the pre-defined target, highlighted on the chart.
In total, we had three winning trades on SPY, staying in a position between one and two days.
Check the chart again to recognize how important it was to exit at target: At both sell signals, the price immediately reversed after the target was reached: In this case perfect market timing on trade entry and exit.
Why did this work?
With our activity based trading system, you can spot and follow institutional money moves as a day trader, swing trader and long-term investor.
We teach one-on-one, how you can specifically apply our systems at your available time and for the assets you prefer to trade: Stocks, options, futures, FOREX.
Day Trading Example: NLT Top-Line, SPY 1-Hour Chart, December 2 – 4, 2015
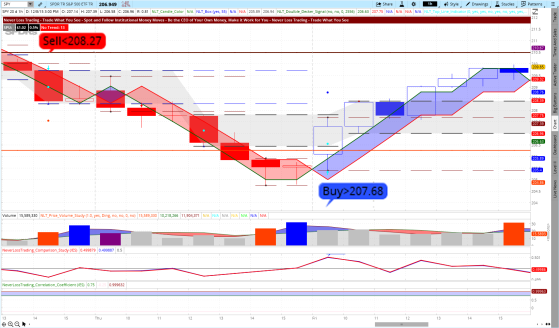
From left to right, you see a late in the day entry on Sell<$208.27 and a day trade that was closed the same day on Buy>$207.68.
Institutional supply and demand specifies the action we filter with our algorithms and paint the potential trade situation on the chart for you.
In case you trade from an IRA account, we show you how to participate in market downs with the help of trading options.
Our charts will help you to figure out where price will turn and where they most probably will go, considering major supply and demand levels, where you can expect institutional orders to drive the price in the one or the other direction:
A significant supply/demand imbalance turns the prices and our systems help you to spot and act on those instances.
This is most likely how you would have seen the same situation on your chart:
SPY Daily Chart without Indicators, November 9 – December 12, 2015
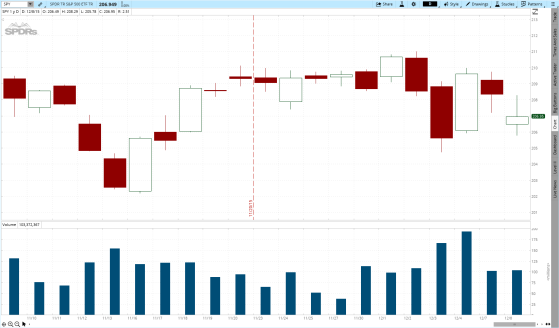
No wonder, that it is hard to make sound trading decisions without a fact based proposition.
Make a difference to your trading and schedule your personal consulting hour to find out which of our systems suits you best:
Call: +1 866 455 4520 or contact@NeverLossTrading.com
If you are not already part of our free trading tips, market reports, and webinars, sign up here.
We are open for new students, capacities are limited, do not miss out.
We are looking forward to hearing back from you.
Good trading,
Thomas

No comments:
Post a Comment