
As an investor or trader, you have multiple choices to determine your trade entries and exits. Long-term, your best chance for making money is in finding chart setups that are repetitive and highlighted by a system, which gives you clearly defined entries, exits and stops.
EUR/USD TradeColors.com 2-Hour Chart
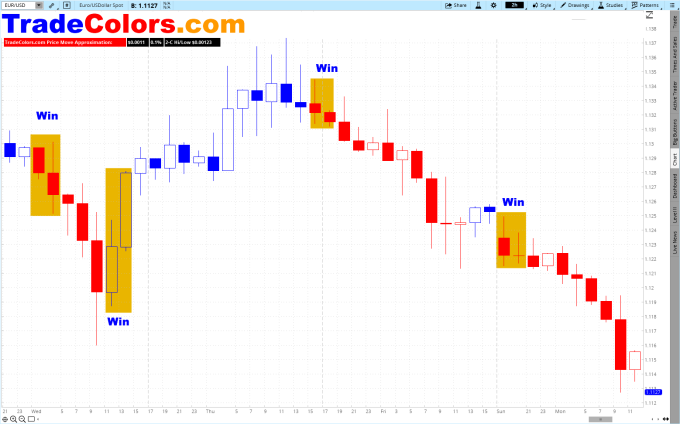
The rules for our TradeColors.com chart setups are simple: two-new-same color candles and you trade when the low of a red-sequence is surpassed by the price development of the next candle (sell-stop-order) or when the high of a new blue candle color sequence is surpassed (buy-stop-order).
Taking the trade setups from the left to the right, if you were able to harvest each opportunity to the fullest you had the chance to produce the following pip gains:
- Trade-1, short, with a potential for a 100-pip-gain.
- Trade-2, long, with a potential for a 80-pip-gain.
- Trade-3, short, with a potential for a 110-pip-gain.
- Trade-4, short, with a potential for a 75-pip-gain.
At times people respond to us: < I do not trade the 2-hour chart > and our response is:
Take a look at the attainable pip-gains and compare them with the returns you produce and you might be open for an income opportunity you did not even think that it exists.
If you like to see how this works live: schedule your personal consulting hour by calling +1 866 455 4520 or contact@NeverLossTrading.com
How about if you are a long-term stock trader?
The TradeColors.com charts surely work; however, we want to give you an insight to our next level system: NLT Wealth Building (swing trading) and NLT Income Generating (day trading).
NLT Weekly Wealth Building Chart for NFLX
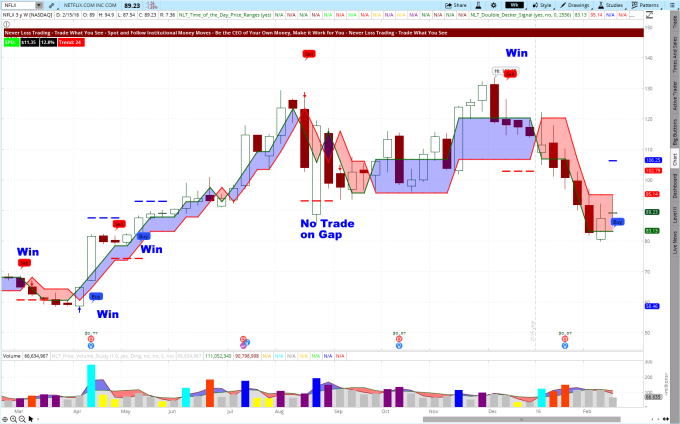
The above chart follows produce a trade entry, when the high of a candle with a Buy> signal is surpassed in the next candle or the low of a Sell< signal. The trade target is set by a red line on the chart. Stops can be trailed with the red line on the chart. Highlighted in blue are up-trending environments, red highlights down-trending environments. In our mentorship and training, you will also learn how to go long and short with any account.
For NLT WealthBuilding + NLT IncomeGenerating, we are running a spring break special, ask us for it:
Call +1 866 455 4520 or contact@NeverLossTrading.com
In case you are a swing trader, who prefers short-term position holdings, which system to take?
All NeverLossTrading systems work for all time-frames and for all asset classes; however, let us highlight our highest level system, which is giving you a high productive rate and clearly defined trade entries and exits (dots on the chart).
NeverLossTrading Top-Line 4-Hour Chart for PCLN
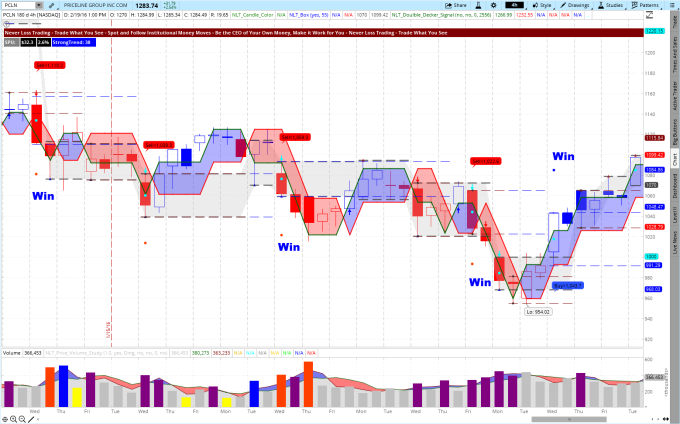
With NLT Top-Line, you receive clearly spelled out action points by price thresholds on the chart: Sell< 1110.20. Immediately, you are ready for your buy-stop order to short the stock or you place an order for buying a Put option (controlling the shares by investing 2-cents on a dollar). In our mentorship (20-hours of training), we teach you how you can short with protection, realizing portfolio margin, plus many more necessities to turn yourself into the trader you want to be.
Find the system and mentorship that suits you best:
Call +1 866 455 4520 or contact@NeverLossTrading.com
We teach one-on-one, focused on highest efficiency, working with Stocks, Options, Futures, FOREX.
We are open for new students, however, while capacities is limited.
If you are not already part of our Free Trading Tips, Reports, Webinars, sign up here … click.
Good trading,
Thomas Barmann
NeverLossTrading
A Division Of Nobel Living, LLC
http://NeverLossTrading.com

No comments:
Post a Comment