
Futures trading is often labeled as high risk; however, if you do not use protective stop orders to manage your risk, trading in general becomes high risk. In our leading trading system: NeverLossTrading Top-Line, red lines on the chart help you to determine and trail stop levels, while we often keep our stop at bay until the first part of a trade comes to target.
E-Mini S&P 500 1-Hour Chart for March 23/24, 2016
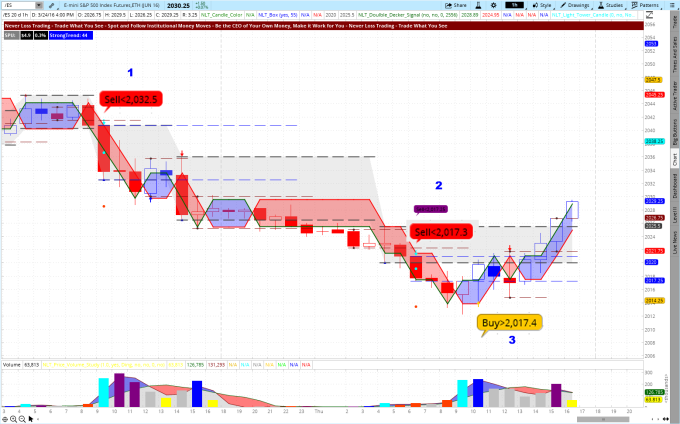
The above chart shows you three trading opportunities, where on the red signals, dots on the chart determine the first exit; for yellow signals, we trade to the next line border and in any case, we only trade, when the candle following the signal candle surpasses the set price threshold. Example (Situation-2) Sell<2 4-point="" a="" an="" and="" are="" at="" candle="" desired="" development="" entry="" exit="" filled.="" for="" gain="" in="" is="" level="" means="" next="" of="" or="" order="" p="" place="" price="" reached="" sell-stop="" the="" this="" trade="" was="" win.="" with="" you="" your="">
When you are working with protective stop orders, futures all of a sudden can become lower risk than stocks, here are some reasons why:
- Our preferred futures markets are open close to 24 hours a day, which means the overnight gap risk is relatively low. Those markets only close for a short settlement period each day, but then open up again and trading resumes.
- The major futures markets we focus on at NeverLossTrading are some of the most liquid markets in the world, which means they are as close to a fair trade as there is and you don’t have to worry about slippage that much, though it can happen; however, if you like to focus on a specific future fitting your specific requirements and purpose, we are surly supporting you with our systems and sound knowledge.
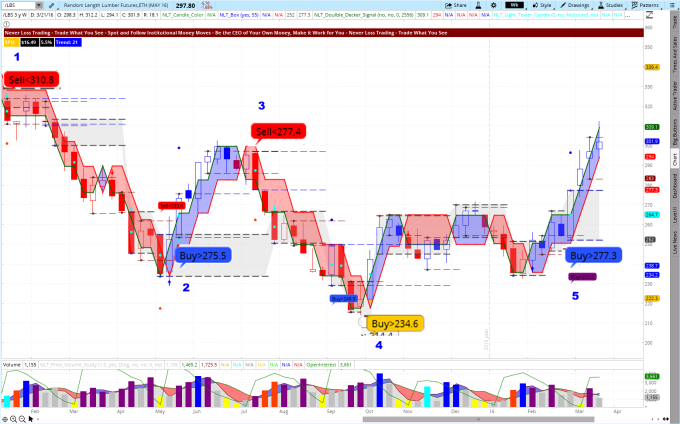
Let us share an example, where we helped a trader who wanted to hedge his lumber production, allowing him to sell at constant prices. We used a weekly chart and below you see those trade situations magnified where the trade direction was confirmed by the next candle surpassing the set price threshold:
Random Length Lumber Futures on the Weekly NLT Top-Line Chart, 2015, YTD 2016
When trading a futures contract, you need to be aware of the value of the instrument you are trading and thus, determine a meaningful price changes to trade for:
The E-Mini S&P Futures Contract currently trades around $2,000. With a related value of $50 per point, you are controlling with one futures contract $100,000 of value. Many and in particular beginning futures traders want to predict the price move with a $50 accuracy and love trading for a 1-point gain or loss. This requires a 99.95% accuracy or a prediction above 4-sigma (a range of four standard deviations). We can only congratulate you if you can do this accurately, but recommend most of our new students to not focus on such short-term trading tasks, by having a very, very little chance for making money and rather focus on trading for bigger targets.
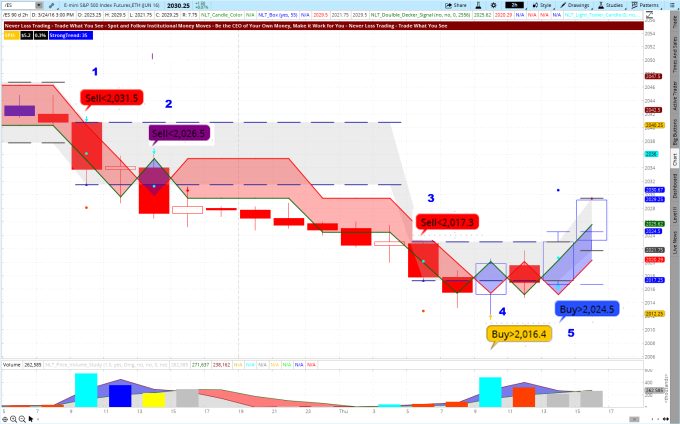
E-Mini S&P 500 2-Hour Chart for March 23/24, 2016
The above chart shows you five trade situations that were confirmed and all of the came to target with an average gain of $225 per contract. This is high probability trading and if you like to be part of this:
Call: +1 866 455 4520 or contact@NeverLosstrading.com
Can you make money trading futures short-term?
Yes, but do not solely rely on one time frame: have a business plan that allows you for participating in bigger price moves, giving you more appropriate returns, than trying to work yourself up point by point, with the risk of constantly being ripped apart by trading in the natural volatility price move of the instrument you are trading.
Instead of scaling down in the time frame to trade, let us show you how to even utilize longer-term charts in your trading.
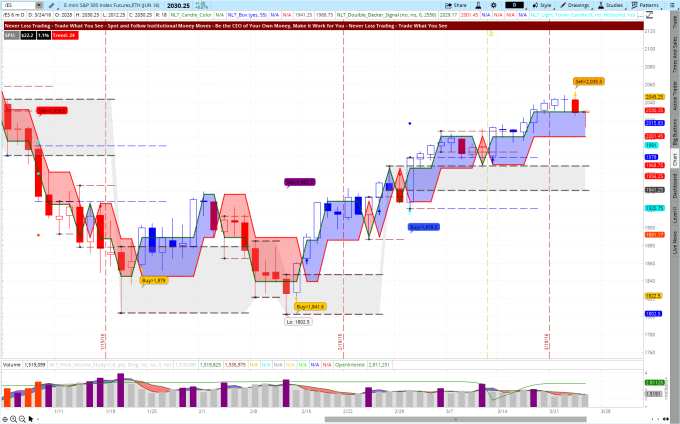
E-Mini S&P 500 Daily Chart for January 1- March 24, 2016
In case you are not ready to take the associated futures trading risk required to trade from daily charts, we teach you in our mentorships, how you can participate in bigger price moves of the underlying by only accepting risk in 100-dollar increments.
We offer a wide variety of NLT mentorships: Take a look…click and let us know for which system you like to schedule a personal and live demonstration for:
Call: +1 866 455 4520 or contact@NeverLosstrading.com
In our mentorships, we focus on one-on-one training and coaching: always prepared, highly effective, and all recorded; so you can repeat what you learned.
Surely, you can combine learning futures trading with stock trading, options trading, FOREX trading.
Prepare yourself for a better trading future.
If you are not yet part of our free trading tips, reports, and webinars...sign up here.
We are looking forward to hearing back from you,
Thomas

No comments:
Post a Comment