Tickety, tickety, tock, time is clicking off the clock and America is going to vote for the next President. Based on the poll numbers, this is going to be a close race.
In the spirit of this election cycle, we thought it would be a good time to clear up a question that comes up at every presidential election:
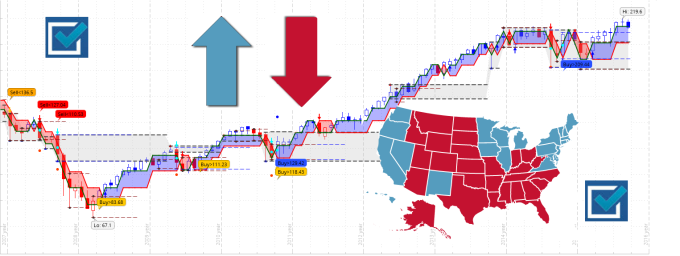
Chart-1: Stock Market Development based on NLT-Top-Line 2007 - 2016
Our answer is and always will be: It does not matter!
When you are a prepared trader or investor:
- You are following a system of pre-indicators, telling you when a price move is likely to happen: blue frames up, red frames down.
- You operate with strategies that produce income if the markets go up or down.
- You can combine longer-term and shorter-term trading strategies.
If this is not the case for you, read on and consider how being trained and prepared can make a difference for you.
Trade What You See: Let the chat tell, when to buy or sell!
Operate with:
Clearly defined entries, exits, and stop or trade adjustment levels.
Follow the pattern of the natural transaction cycle:
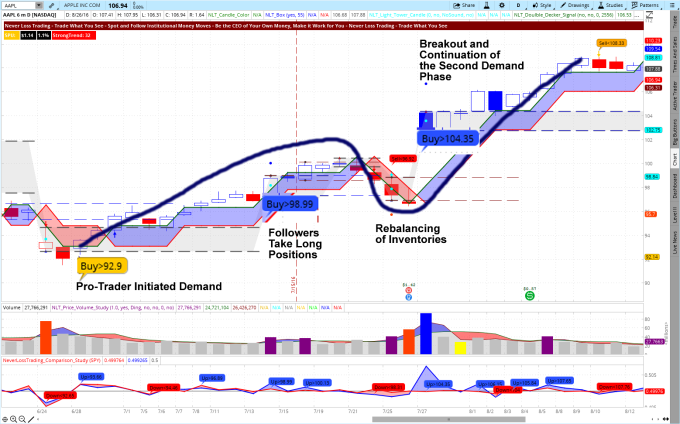
Chart-2: AAPL Daily Chart, June 22 – August 16, 2016

Institutional investments dominate 95% of all financial market transactions for stocks, options, futures, currencies.
By the sheer size and the interaction pattern of institutional leaders, gate keepers, and followers; our algorithms paint early price move potentials on your chart, so you can spot and follow institutional money moves:
- Entering when they happen.
- Exiting before they end.
Let us get you some examples and if you feel those can make a difference for your trading, ask us for a live demonstration, where you call the symbols and times and we jointly count good and bad trades:
Call: +1 866 455 4520 or contact@NeverLossTrading.com
By measuring and orienting at the underlying structure of the financial markets, our indicators are able to produce high probability directional chart setups for you that work on all time frames and for all asset classes: stocks, options, futures, currencies.
Our first example is a swing trading example:
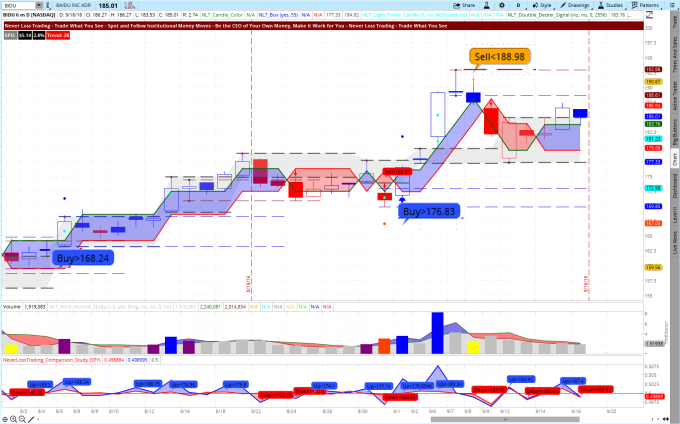
Chart-3: BIDU Daily Chart, August 2 – September 16, 2016

Following our system, you trade when a specific spelled out price threshold is surpassed in the next candle: Buy > 168.24 e.g. This way, you can operate with Buy-Stop or Sell-Stop orders and pre-program your trade entry without the need for being in front of your screen.
In our mentorship program, you also learn how to participate in those trades with simple option strategies, requiring you only a fraction of the share cost: 1-3%, and letting you participate in price moves to the up- or downside with a limited risk and a potential leverage.
To support your trading in and out of the election cycle, ask us for our election special on:
- NLT Top-Line Light.
- NLT Wealth Building and Income Generating.
By teaching one-on-one, we will work with you at your best available times and focus on your specific wants and needs as a trader or investor.
Every training session will be recorded, allowing you to go through the learned on any of your mobile devices.
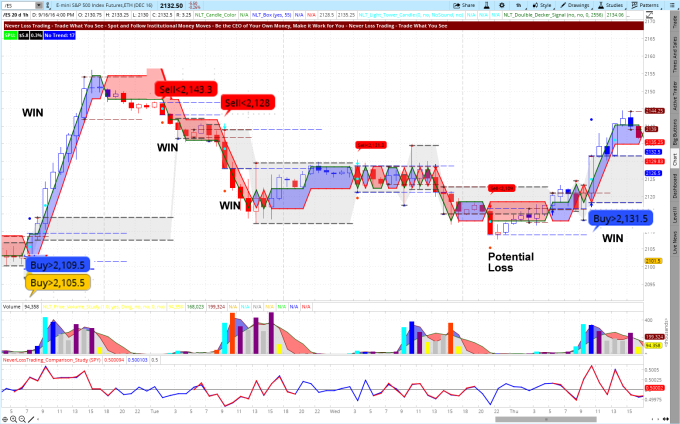
Chart-4: S&P E-Mini Futures Hourly Chart, September 12 – September 15, 2016

Chart-4 shows you five potential trade situations, highlighted by the system. When you traded them mechanically, you achieved four winners and one loser: 80%-success rate; however, you will also learn that some trade situations spelled out on the low are not a good place to trade at.
Your trade rules are simple:
- Trade, when the next candle surpasses the spelled out price threshold.
- On red and blue signals, trade to the target dot or for five same-color-candles.
- On orange signals, trade either to the next horizontal line or for a maximum of 10-bars.
- If you like to trail your stop, trail with the red line of the box that is framing the price move: Expect a change in price momentum, when the red line is reached.
There is sure more to learn and we teach you in one-on-one sessions, focusing on your wants and needs as a day trader, swing trader, long-term investor or in applying a combination of multiple time-based strategies; helping you to build a business plan for your trading success: financial plan and action plan. Setup a live demonstration:
Call: +1 866 455 4520 or contact@NeverLossTrading.com


No comments:
Post a Comment