Spot and Trade Institutional Money Moves

Algorithmic Trading with Human Interaction for:

Day Traders, Swing Traders, Long-Term Investors

Showing posts with label Institutional Investors. Show all posts

Saturday, January 8, 2022

Fear and Excitement in Trading

Acting in the world of trading and investing requires you to prepare in multiple dimensions, and we want to share a step-by-step approach to implement and follow.

  1. Introduction

Trading offers you as a retail trader unique opportunities to participate in a money-making business with little setup costs, flexible work hours, no need for collection; operated from any place with an internet connection.

As a professional business, trading requires skill but does not require passing a test or obtaining a license. Every participant is free to risk money; just an online broker is needed, and you are in business.

However, when you think that you enter a professional business, what is your likelihood that you have a chance of winning right out of the gate?

Fear and Excitement in Trading by NeverLossTrading

The game of tennis provides an analogy for understanding what happens by trading in the financial markets. Imagine a match between a tennis professional and a weekend warrior. They use the same equipment, play on the same court, and abide by the same rules. But the professional will have a better technique and strategy and will be prone to fewer errors. In the world of investing, institutions are the professionals, and individuals are the weekend warriors.

Instead of trying to beat institutional investors, we encourage and support you to transform yourself into acting along with them by copying their actions.

But where is your edge for winning?

As a retail trader, you can enter and exit entire positions at once. Big money has to scale in and out of positions not radically to change prices, and such, your edge is in the speed of entering and exiting positions.

You need a system that tells you when high probability setups are on the brink and how to forecast price move potentials.

Your trading edge is finding high probability setups and acting faster than the big money can. However, this is easier said than done. Trading is not only a logical action taking; it will challenge your emotions: fear and excitement come into play. Before we get there, let us clarify where you can operate in the financial markets.

2. The Financial Markets Explained

Overview of the Financial Markets

When we talk about financial markets, what do we mean?

The financial market provides a platform for buyers and sellers to meet for trading assets at a price determined by supply and demand. Typical trading instruments are shares, securities, bonds, derivatives, etc.

The typical financial market participant is an institution. An institutional investor is a company or organization that invests money on their behalf or on behalf of other people.

We distinguish six different financial markets by their focus.

Overview of the Financial Markets

Roles of Institutional Investors
  1. The Money Market focuses on the lending or borrowing of loans with a wide range of maturities. Here you find the typical banks and financial institutions as providers and corporations, and private persons to take the financing. Standard instruments of the money market are treasury bills, commercial papers, certificates of deposit, bills of exchange, etc.
  2. In Capital Markets, you find stock trading and bonds in focus. The financing purpose is for lending or borrowing money for the longer term.
  3. The Derivatives Market deals with trading Futures, Options, Forward Contracts and Swaps. Derivatives derive their value from the underlying assets, and they either function to manage financial risks or are used for speculation on the price change of the underlying asset.
  4. Commodity Markets facilitate trading commodities like gold, oil, wheat, rice, etc. There are around 50 major commodity markets all over the world.
  5. The Foreign Exchange Market allows the trading of currencies. These markets are operated through financial institutions and determine foreign exchange prices for every currency.
  6. Spot Market is a market where transactions are done on the spot and in cash only.

If you operate in one or all of the listed financial markets, the other side of your trade has an 85% chance of being accepted by an institution.

The financial markets offer organized exchanges to buy and sell securities. The core function of an exchange is to ensure fair and orderly trading and the efficient dissemination of price information for the securities trading on that exchange. Institutional investors act in different roles and can simultaneously have more than one role.

We differentiate by their focus three categories of institutional investors operating at the exchanges:

In a simple graphic, we express the following roles institutional investors take:

Roles of Institutional Investors

Roles of Institutional Investors

In the above graph, we mentioned only some of the market operators, but you might now see how the model of the crowd is following the leaders comes into play. When prop traders, for example, initiate a buy-in or sell-off, it gets noticed, and the market either copies and follows or trades against the happening.

We have already learned that key institutions lead the market. Where we find leaders, there are followers. When the leaders make a move, the crowd follows. In essence, we are trading with people and their emotions.

3. Fear, Excitement, Indecision

Trading involves emotions, which are often triggered by subconscious programs that come into play, which are not easily accessible but need to be managed with the proper knowledge and tools.

The majority of traders experience fear, excitement and indecision, daily as a stimulus that compromises their capacity to trade effectively. 

Learning to handle your emotions builds the basis for living up to the needed performance in trading.

Like in gambling, winning excites, and so does the participation in the game to win. However, in trading, you are following logic. You use computers to support your decision-making. Here is where we can help you overcome critical emotions, but it needs a system and training and is not a given.

Let us describe the basis of the emotions to explain then how to handle them:

Excitement is an extension of the natural emotion of joy or happiness. We can be safely happy for days at a time. However, it is not safe to experience excitement constantly. It compromises our immune system by flushing dopamine through our brain (thus damaging our brain's ability to act reasonably) and ultimately harming our immune system when our brain fails to tell it to react to attacks or changes. For example, to experience excitement constantly would be to take an illegal drug. Drug addicts want to stay high because they feel the need to experience the excitement as much as possible.

More than 95% of the people involved in the stock market know only one way to make money: when prices rise. As a result, stock market rallies usually build a lot of excitement and attract more and more people to rush into trades to be part of the upwards move.

Fear extends the natural emotion called apprehension, which produces the fight or flight response to dangerous situations. We need apprehension (or caution, if you will) to protect ourselves from risks that we need not take or that might impose on us.

In fearful situations, our adrenal glands pump epinephrine (Adrenaline) through our bloodstream so that we can act quickly. No one is born with fear. We learn it. Sometimes, fear just happens to us, such as developing a fear of heights or cramped places. Other times fear is imposed on us: For example, you hold a position and prices fall, then the fear of losing kicks in, and you try to get out of such a situation without getting hurt. Even so, the stock market cannot be personalized; such a situation is succumbing to a threatening situation imposed by someone else.

Indecision or ambiguity reflects an emotional stage where we cannot decide to act excited or fearful. Without emotion, you cannot make a decision. Yet most people think they are rational beings who make decisions deliberately, logically. Decision-making means making a judgment between two or more alternatives. We help our NLT Top-Line and HF clients identify times of indecision by what we call the "NLT Purple Zones." This indicator on the NLT price charts identifies times or zones where the ambiguity of emotions leads to indecision until a decision is made. We then either run with it:  scared or excited.

Having the "Purple Zone" on the chart is a potent tool because we expect a directional decision at the end of the zone in one or the other direction. The immense value of the NLT Purple Zone is for you not to waste your money when no direction is found: traders with experience know times, where you get constantly stopped. With the help of the  NLT Purple Zone, you just do not open new positions when it is prone. As you know by now, those decisions are made by the key market influencers, and it is an excellent strategy just to follow.

With the NLT-Method, we analyzed the human emotions of Fear and Excitement to paint a digital wave over a decision-making graph. The following study shows how our indicators put the price development and emotions on a chart. 

Price Chart and Human Emotions

SPY Daily NLT Price Charts with Fear, Excitement, and Indecision

The daily SPY chart (ETF of the S&P 500 Index) combines NLT Top-Line and Trend Catching indicators. It paints uptrends in blue and downtrends in red; when red and blue mix, purple identifies a zone of directional indecision, where we do not open new positions.

You will find the same happening on any timeframe, tick frame or price range and for every asset:

Crude Oil Futures, One Hour Chart

Crude Oil Futures NLT 1-Hour Price Chart with Fear, Excitement, and Indecision

We help you to handle your emotions by putting clearly spelled-out visual signals on the chart for you so that you can act mechanically:

  • Buy > or Sell <, and the signal only leads to a trade when the spelled-out price threshold is surpassed in the price movement of the next candle.
  • Each trade situation has a forecast of the price move distance to trade for: dot on the chart. There you take your exit.
  • Depending on the signal, the stop sits at a red crossbar or the bottom of the trade initiation candle.
  • You will know the probability of coming to the target for each signal constellation, and such you can make rather logical than emotionally driven decisions.

Accepting the probabilities of your decision-making diminishes the fear of losing and lets you follow a path of positive expectations.

We are more than 10-years in the trading education business, teaching one-on-one at your best available days and times.

Trading our own account day-by-day and helping clients lets us provide long-term experiences and support. Customer service and tailored mentorships are our virtue. Following this principle, we provide:

  • Server-installed Software
  • Real-Time Data
  • System-Defined Entries, Exits, and Stops
  • Position-Sizing
  • Time-in-a-Trade
  • Trading-Strategies
  • Risk-Handling
  • Business Plan (financial- and action plan)
  • Own scanners to find investment opportunities
  • Watch list indicators for finding changes in supply and demand on multiple time frames

Basing your trading and investing decisions on defined rules is learnable, and we are here to support you!

Schedule your consulting hour! Working one-on-one spots are extremely limited: Do not miss out!

+1 866 455 4520 or contact@NeverLossTrading.com

With the NeverLossTrading concepts and education, we want to help you de-complex trading decisions and come to high probability trading by solving the challenges with the help of our systems on the spot.

Five Dimensions of Trading and Investing Decisions

Follow our free publications and webinars…sign up here.

Strive for predictable trading results with a system that helps you for repetitive logical decisions rather than being run by emotions.

We are here to help,  and we are looking forward to hearing back from you,

Thomas

www.NeverLossTrading.com

Disclaimer, Terms and Conditions, Privacy | Customer Support

Wednesday, March 24, 2021

Measure and Follow Money Flow

 The basis of NeverLossTrading is to measure and follow money flow: a powerful approach for high probability trading and investing.

Where is the edge:

As a private investor, you are faster in out of positions than institutions can do.


We use complicated algorithmic models to indicate when to expect directional price moves and how far they shall reach. But you do not need to be concerned about the math; our systems put clearly defined entry, exit, stop-conditions on the chart for you: easy to read and follow. Here a day trading example:

NLT Timeless E-Mini S&P 500 Futures, March 23, 2021


The NLT Timeless approach takes time out of the cohesion and concentrates on the price change as the triggering element to trade:

What you see on the chart:

1.  Sell Signal: Sell < $3,922.8, and in the price movement of the next candle, the set price threshold for a sell-stop order was surpassed and triggered a short trade.

2.  Target-1: Gray dot on the chart, standing for the short-term trading goal. Here about 8-points or a value change of the underlying futures contract of $400.

3.  Target-2: Further out target, we trail for with the red line of the NLT Double Decker, framing the price move in red.

4.  NLT Lime Line: A price gravitation line. Ther, we assume price accumulation but also a pressure for prices to get to this level. In our case, the NLT Lime-Line and target-2 coincide and allowed for a 22-point price change or a value change of the underlying futures contract of $1,100.

5.  The chart shows muliple price continuation signals on the way down, which we appreciate but disregard while we are in a trade.

The system sure works for other assets too, and if you are interested to learn more: contact@NeverLossTrading.com, Subj. TimeLess

Institutional investments dominate more than 85% of the financial markets. Price is the result of a change in supply and demand. It is good to know where the institutional money goes; such, our indicators mapped out the sectors with extraordinary attention during the trading day of March 23, 2021. The NeverLossTrading indicators highlighted sectors NLT Power Tower setups (exceptional happenings): indicating selling pressure in the sectors of Biotech and Gold Miners.


Today, March 24, 2021, at 8:30 a.m. ET, Durable Goods orders will give an indication for the industry sector development, which had selling pressure yesterday. At 10 a.m. ET, Federal Reserve Chair Jerome Powell testifies before Congress, providing a broad overview of the economy and monetary policy. Powell's prepared remarks are published ahead of the appearance on Capitol Hill. We report more details on our NLT Alerts, where we list stocks and funds with a price move indication.

Follow our market indications on Instagram: https://www.instagram.com/neverlosstrading/

We focus on teaching systems and strategies to operate in the financials market one-on-one, at your best available days and times.

Let us be your guide to a consistent trader and investor and schedule a free consulting session, where you can see live what our systems can do for you:

contact@NeverLossTrading.com Subj: Consulting Hour

Working one-on-one spots are extremely limited: Do not miss out!

For more of our free publications and webinars…sign up here.

We are looking forward to hearing back from you.

www.NeverLossTrading.com

Disclaimer, Terms and Conditions, Privacy | Customer Support


Friday, August 21, 2020

Trading for Predefined Price Moves

 As a trader or investor, you want your actions not to be predictable. 


Right from our research desk, we show you an example of how to trade for system-defined price moves: 

  • Limiting risks
  • Operating with upside opportunities
  • Trading along developing trends and key price turning points

Experience in less than five minutes how this can change your trading: 

Watch our short video…click. 

This image has an empty alt attribute; its file name is intro-volatility-and-market-timing.png

We hope this catches your interest. 


If yes: Let us get super interactive, and we meet with you in a one-on-one meeting online to test how it runs live. We want to have a content filled conversation with you.


No, there is no charge, I just want to make sure it's GOOD ...and the only way that can happen is if you get personal attention. That's why I only want twenty individual conversations max.

Schedule your consulting hour:

Call +1 866 455 4520 or contact@NeverLossTrading.com 

We are looking forward to hearing back from you.

Sign up for our free trading tips, webinars, and reports...click.

Disclaimer, Terms and Conditions, Privacy | Customer Support

Saturday, February 29, 2020

Quantitative Analysis for Trading and Investing


With the help of quantitative analysis, mathematical models can be built for evaluating underlying changes in supply and demand, extrapolating high probability price move signals for you.
We want to provide you an intro into the world of quantitative analysis by a free eBook, where we measure the influence of success factors on the return on capital (ROC) achievable.
This image has an empty alt attribute; its file name is intro-mutidimensional-arrows.png
We share in this article how to consider multidimensional decision-making models for finding and executing financial decisions with stocks, options, futures, FOREX, and share in some examples how trading and investing decisions can be provided for you.
For getting those key determining success factors into your knowledge and skillset, schedule your personal consulting hour:
Call +1 866 455 4520 or contact@NeverLossTrading.com
We offer multiple systems and will find out what suits you best. By working one-on-one, spots are extremely limited.
Subscribe to our free trading tips, reports, and webinars.
We are looking forward to hearing back from you.
NeverLossTrading
A division of Nobel Living, LLC
401 E. Las Olas Blvd., Suite 1400
Fort Lauderdale, FL 33301

Sunday, December 4, 2016

High Probability Trading and Investing

“It's tough to make predictions, especially about the future.”
This quote, given by the famous baseball player Yogi Berra already summarizes the problem trader’s constantly face: Finding repetitive situations, where the future price move of an asset can be predicted with high probability.
Trading systems shall provide you with a structured approach to tell which situation to consider and which not: where to place your entry, exit, and stop or adjustment level.
But what is high probability compared to the opposite: low probability?
Our definition is easy: A system that gives you trade setups, verified by past performance, where you have a >63% probability to predict the future price happening is high predictability and everything else is low probability.
Let us give you some examples:
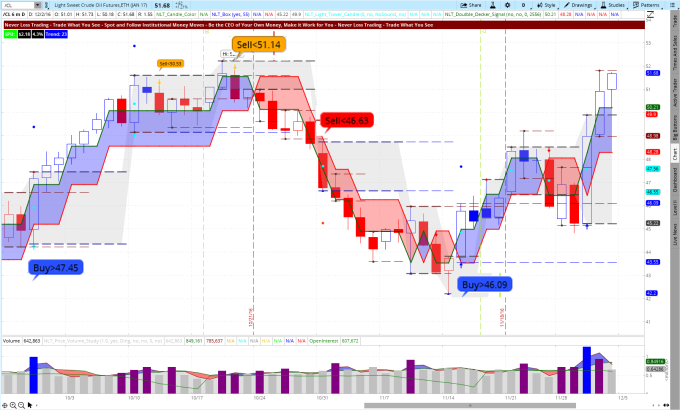
NeverLossTrading Top-Line Chart for Crude Oil: September 26 – December 2, 2016
crude-oil-nllt-top-line-september-29-to-december-2-2016
The NeverLossTrading Top-Line chart shows you five potential trade situations that all have an easy condition to specify your trade entry:
The spelled out price threshold: Buy>$47.45Sell<$46.63 has to be surpassed in the next candle. Only when this is given, you accept the trade; allowing you as a trader to work with buy-stop or sell stop orders. This way, you do not even have to be in front of your screen: you can preprogram your trades to this condition and have them auto-filled.
When you check the above chart, following this principle mechanically, lead to four winning trades (magnified) and one losing trade (first orange signal from the left): winning four out of five, gave our system in the observed time frame an 80% predictability and thus, high probability!
When you consider the following simple exit rules: At red and blue signals, consider that a price move that starts in a NLT Light Tower (candles with a cyan color dot), likes to end in a NLT Light Tower. In addition: you are in average, five bars in a directional trade on those signals. Putting this together, is giving you an easy game plan to follow. On orange signals, we even like to trade for 10-bars.
But what to do if your risk tolerance does not allow you to trade daily crude oil charts?
We teach you how to trade derivatives, scaling your risk levels in $50 or $100 increments.
Does that also work on lower time frames?
Absolutely, we us fractal based mathematical models, focused on spotting and following institutional money moves and this way giving you repetitive happenings: let us put a proof to it!
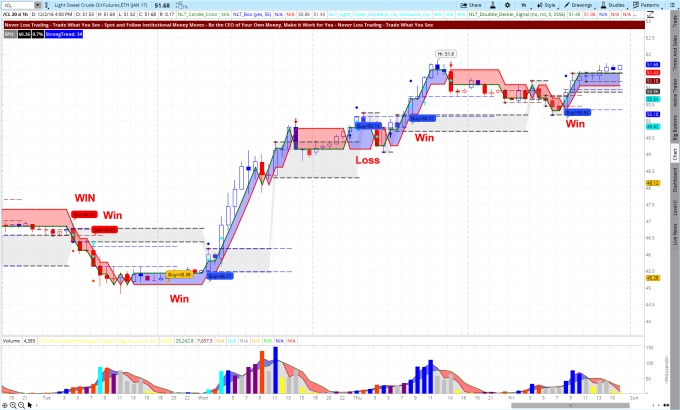
 NLT 1-Hour Top-Line Chart for Crude Oil, November 29 to December 2, 2016
crude-oil-nlt-top-line-1-hour-chart
The chart shows you six trade situations that were validated by the next candle ticking out the set price threshold, leading to five winners and one loser: 83% probability for success in the observed time frame.
We teach our systems one-on-one, focusing on your specific wants and needs: NLT Top-Line is our top of the line; however we also offer entry level systems and allow traders to upgrade later, discounting the tuition payment from the price of the upgrade.
Take a look at our offering…click and let us know which system you want us to give you a personal demonstration on.
Call +1 866 455 4520 or contact@NeverLossTrading.com
By teaching one-on-one, spots are extremely limited, so do not miss out!
We are looking forward to hearing back from you,
Thomas

Saturday, November 26, 2016

Trade Touchdowns at Price Turning Points

Are you trading at price turning points?
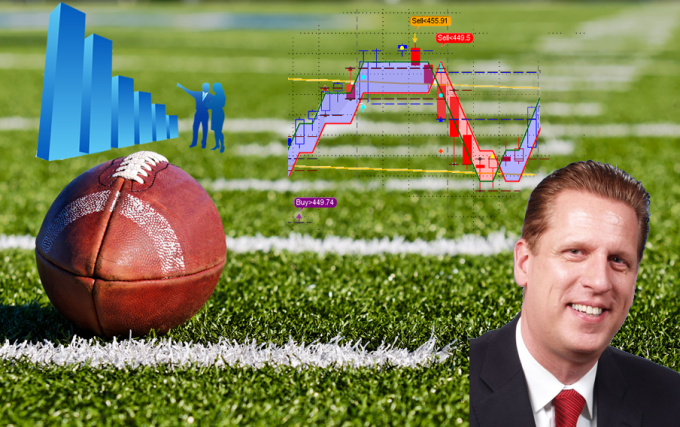
We provide you with systematic, software, strategies, a business plan (financial- and action plan), coaching, documentation; in recorded one-on-one training session, helping you in developing yourself into the trader you want to be.  
Our trading systems provide you with systematic repetitive entries, exits, and stops; then you can act like a sport’s pro: lining up, getting to your position, catch, and touchdown.
touchdown-by-neverlosstrading
What you want and need to be a successful trader has to be learned, practiced, and coached.
We are teaching one-on-one, showing you how to follow the activity of institutional investors with multiple systems for all asset classes: Stocks, Options, Futures, FOREX.
Let the chart tell when to buy or sell; however, you always remain the chief commander, who is in charge of the final decisions:
Computers are faster, humans are smarter.
In our mentorships you will learn how to combine both virtues into powerful acting.
Let us check for a few recent examples:
BK Daily NLT Top-Line Chart, 10-7-2016 to 11-25-2016
bk-nlt-top-line-example-november-2016
Table-1: BK October and November 2016 Trading Results
SignalReachTargetResult
Red Sell>39.79Target dot or 5-barsBoth targets reached1.3%-Return
Orange Buy>39.8610-barsTarget reached9.6%-Return
Blue Buy>42.34Target dot or 5-barsBoth targets reached3.2%-Return
Blue Buy>44.04Target dot or 5-barsBoth targets reached7.7%-Return
Add this up, compound your interest, and check and balance with your today’s results.
How do you know that this stock had such signal?
The NLT Top-Line user has two choices:
Is the chart above an exception?
No: Institutional investors constantly move money in or out of an asset or asset class. Our programs, scanners, and indicators are programmed to detect institutional money moves in a pre-stage, allowing you to be part of the price move when it happens:
  • With a pre-defined time in the trade.
  • At a pre-defined exit- and stop level.
Surely, stops can be trailed if desired: You use the red line of the chart to do so.
All of this you will learn one-on-one at your best available time, with months of free alerts and coaching, giving you the feedback you need to start your career as a trader or investor.
If you want to read yourself into what is needed to the trader or investor you want to be, you will find an easy summary in our book: Your Trading Career as a Private Investor, available at Amazon.
Here another example, where you find key price turning points highlighted by the NLT Top-Line signals.
Take part of the touch downs and ask for a live demonstration:
Call +1 866 455 4520 or contact@NeverLossTrading.com
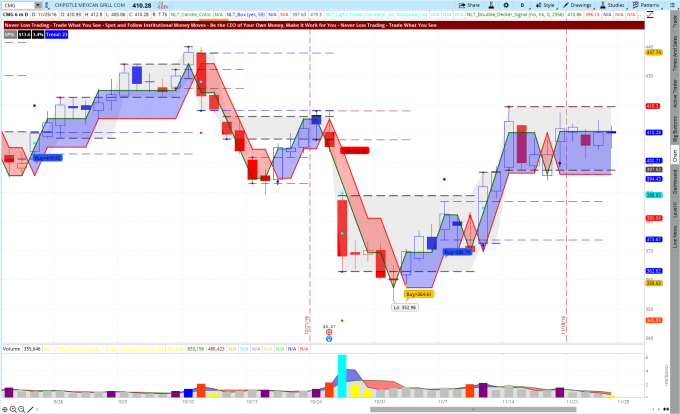
CMG, Daily NLT Top-Line Chart, 9-20-2016 to 11-25-2016
cmg-on-the-nlt-top-line-chart-november-2016
Does the system also work on lower time-frames?
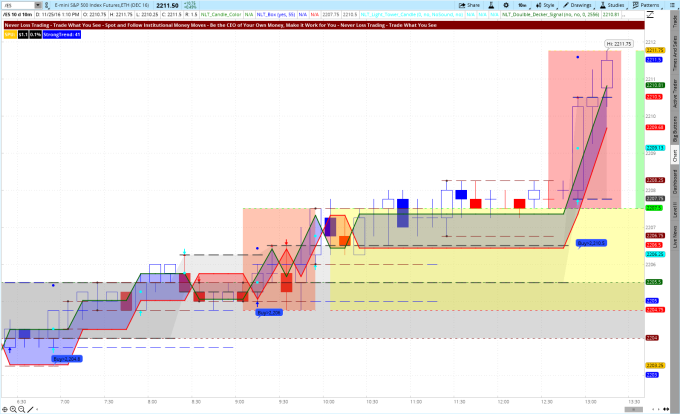
Absolutely: Let us display yesterday’s trading session: November 25, 2016 – Surely not an exciting day, a half-day session right after Thanksgiving.
However, there were three signals that called for a buy.
All of them got confirmed: The next candle ticked out the set price threshold. This allows you to operate with buy-stop or sell stop orders. Each of those trades ended to reach their target.
E-Mini S&P 500 Futures on a 10-Minute NLT Top-Line Chart
November 25, ES NLT Top-Line Chart.png
We offer multiple systems and you will find out in a personal session, which system or mentorship suites you best, please take a look at our offering…click.
Let us know what you are interested in and call +1 866 455 4520 or contact@NeverLossTrading.com for a personal demonstration.
By teaching one-on-one, spaces are limited, so do not miss out.  
Good trading,
Thomas

Tuesday, October 18, 2016

The Power of Trading the Right Hour

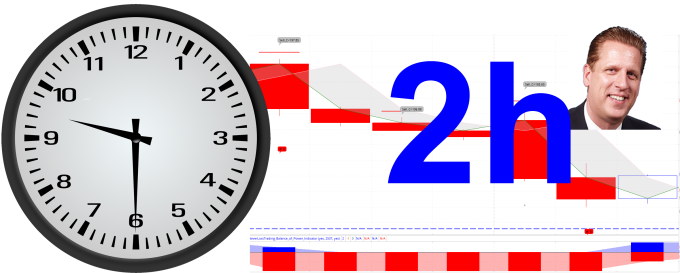
Based on history, the number twelve has a high importance in human life; however, in the last two centuries we started to focus on the decimal systems and consider that everything works 24/7.
Watch the video…click or read on:
clock-with-trendcatching-chart-and-tb
When you cut your trading day into two hour increments, you divide the day into 12 trading opportunities for six days of trading.
Why six trading days?
The futures and FOREX markets open Sunday and close Friday.
Let us show you a couple of examples how this looks on a chart and later explain why the 2-hour time frame is powerful for you (has to do with signal to noise).
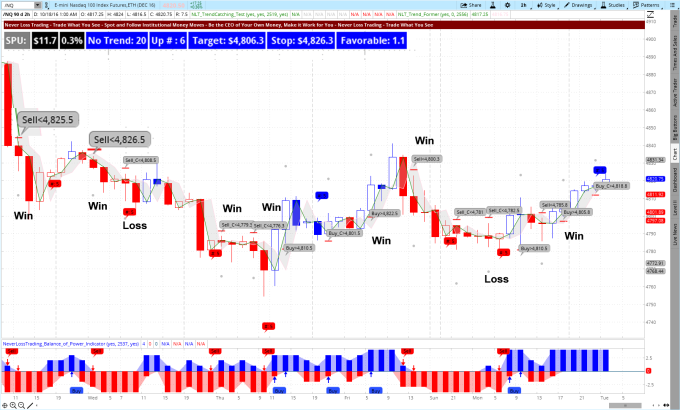
NASDAQ E-Mini Futures on a 2-Hour NLT Trend Catching Chart
nasdaq-futures-trend-catching
The above chart shows 10-trading opportunities in four days, seven winners (70%) and three losses (30%) by just following the signal mechanically: Certainly high probability trading; however, we also teach in our mentorship how to appraise trades situations individually, risking more when the odds are in you favor and allow ourselves to not trade if this is not the case.
In the left upper corner of the chart you see SPU: our measure that defines bar by bar how far a price move most likely reaches after institutional engagement is found. The expected price move distance is marked by a gray dot on the chart.
Further you are getting an indication if you are in a trending environment: blue for up, red for down. To help you entering your bracket order, a target and stop point are expressed bar by bar, with an appraisal of the reward to risk ratio:
Our NeverLossTrading dashboard to simplify your actions.
The bottom study: NLT Balance of Power shows you if Buyers dominate (blue) or Sellers (red), spelling out additional trading opportunities with buy and sell bubbles, that are either confirming the upper chart signals or producing own directional price indications.
Instead of trying to catch the entire price move from the beginning to the end, the NLT Trend Catching system supports you by dissecting trends into price increments, so you can trade multiple times in a directional price move.
How does this work with stocks?
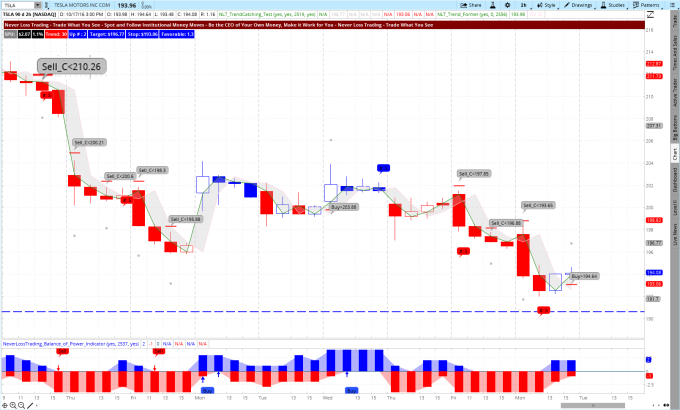
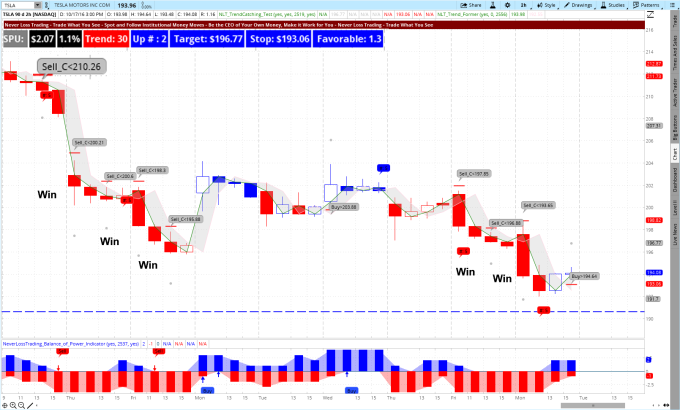
TSLA on a 2-Hour NLT Trend Catching Chart: October 5 – 17
tsla-trend-catchin-october-2016-1
On October 5th, late in the day, we receive a short signal and we are catching a very nice move to the downside, producing a $8 price move. Then we further participate on the second wave of the price breakdown with a signal on October 7th, 2016. In the days of October 10 – 13, we receive no signal confirmation and no trade, to then be active again on October 14th and 17th, to harvest on the breakdown. In total, we are producing five winners out of five potential trades in total a price move of about $18 in nine days:
A 9% return on cash, an 18% return on margin and humongous return on Option trading capital if you follow our specifically developed option trading program.
TSLA on a 2-Hour NLT Trend Catching Chart: October 5 – 17
tsla-trend-catchin-october-2016-2
 If you like to be part of this, ask for our Election Special on NLT Trend Catching.
Call +1 866 455 4520 or contact@NeverLossTrading.com
By teaching one-on-one, focusing on your specific wants and needs, spots are limited, so do not miss out.
Good trading,
Thomas

Tuesday, September 27, 2016

Who is the better President for the Stock Market?

Tickety, tickety, tock, time is clicking off the clock and America is going to vote for the next President. Based on the poll numbers, this is going to be a close race.
In the spirit of this election cycle, we thought it would be a good time to clear up a question that comes up at every presidential election:
Who is better for the stock market?

Watch this publication as a video presentation...click
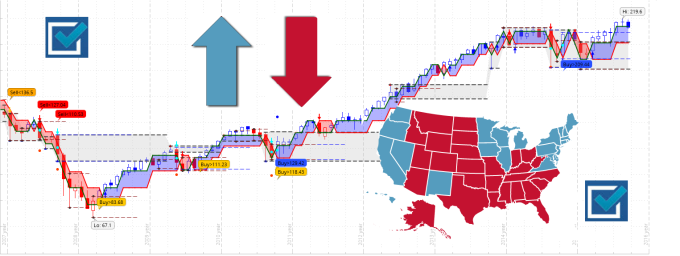
Chart-1: Stock Market Development based on NLT-Top-Line 2007 - 2016
Video Presentation
Our answer is and always will be: It does not matter!
When you are a prepared trader or investor:
  • You are following a system of pre-indicators, telling you when a price move is likely to happen: blue frames up, red frames down.
  • You operate with strategies that produce income if the markets go up or down.
  • You can combine longer-term and shorter-term trading strategies.
If this is not the case for you, read on and consider how being trained and prepared can make a difference for you.
Trade What You See: Let the chat tell, when to buy or sell!
Operate with:
Clearly defined entries, exits, and stop or trade adjustment levels.
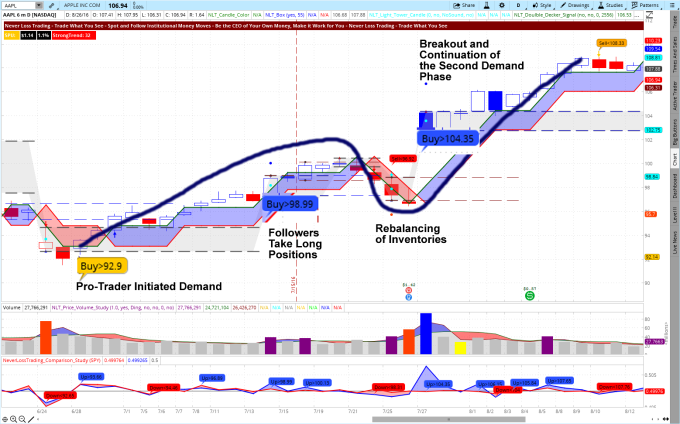
Follow the pattern of the natural transaction cycle:
Chart-2: AAPL Daily Chart, June 22 – August 16, 2016
aapl-june-22-to-august-12-2016-rebalancing-2
Institutional investments dominate 95% of all financial market transactions for stocks, options, futures, currencies.
By the sheer size and the interaction pattern of institutional leaders, gate keepers, and followers; our algorithms paint early price move potentials on your chart, so you can spot and follow institutional money moves:
  • Entering when they happen.
  • Exiting before they end.
Let us get you some examples and if you feel those can make a difference for your trading, ask us for a live demonstration, where you call the symbols and times and we jointly count good and bad trades:
Call: +1 866 455 4520 or contact@NeverLossTrading.com
By measuring and orienting at the underlying structure of the financial markets, our indicators are able to produce high probability directional chart setups for you that work on all time frames and for all asset classes: stocks, options, futures, currencies.
Our first example is a swing trading example:
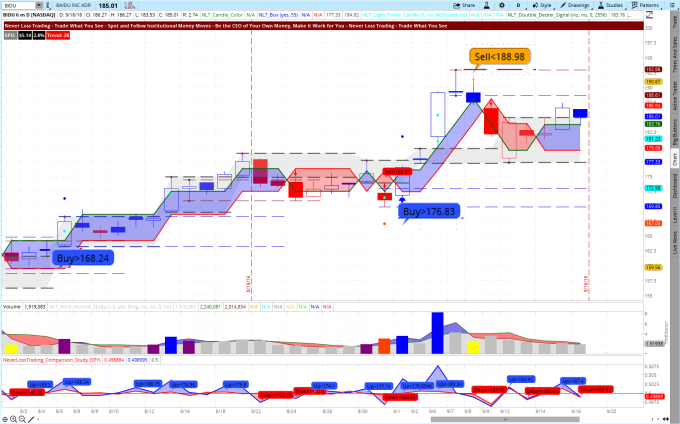
Chart-3: BIDU Daily Chart, August 2 – September 16, 2016
bidu-top-line-september-2016
Following our system, you trade when a specific spelled out price threshold is surpassed in the next candle: Buy > 168.24 e.g. This way, you can operate with Buy-Stop or Sell-Stop orders and pre-program your trade entry without the need for being in front of your screen.
In our mentorship program, you also learn how to participate in those trades with simple option strategies, requiring you only a fraction of the share cost: 1-3%, and letting you participate in price moves to the up- or downside with a limited risk and a potential leverage.
To support your trading in and out of the election cycle, ask us for our election special on:
  • NLT Top-Line Light.
  • NLT Wealth Building and Income Generating.
By teaching one-on-one, we will work with you at your best available times and focus on your specific wants and needs as a trader or investor.
Every training session will be recorded, allowing you to go through the learned on any of your mobile devices.
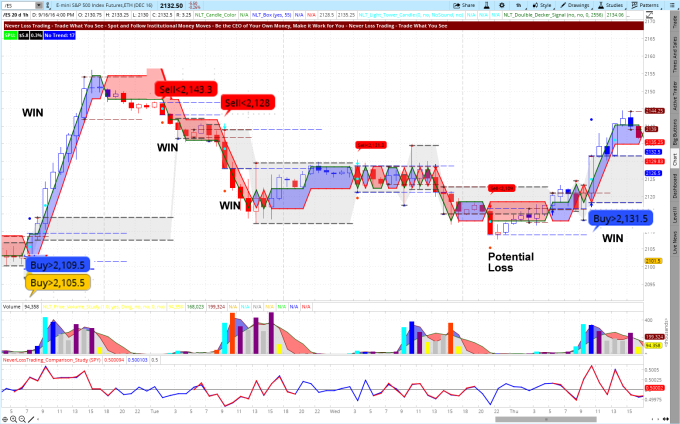
Chart-4: S&P E-Mini Futures Hourly Chart, September 12 – September 15, 2016
top-line-es-september-12-to-15-2016
Chart-4 shows you five potential trade situations, highlighted by the system. When you traded them mechanically, you achieved four winners and one loser: 80%-success rate; however, you will also learn that some trade situations spelled out on the low are not a good place to trade at.  
Your trade rules are simple:
  • Trade, when the next candle surpasses the spelled out price threshold.
  • On red and blue signals, trade to the target dot or for five same-color-candles.
  • On orange signals, trade either to the next horizontal line or for a maximum of 10-bars.
  • If you like to trail your stop, trail with the red line of the box that is framing the price move: Expect a change in price momentum, when the red line is reached.
There is sure more to learn and we teach you in one-on-one sessions, focusing on your wants and needs as a day trader, swing trader, long-term investor or in applying a combination of multiple time-based strategies; helping you to build a business plan for your trading success: financial plan and action plan. Setup a live demonstration:
Call: +1 866 455 4520 or contact@NeverLossTrading.com