
In this publication you will experience how to translate high probability daily chart setups into short-term trades with very favorable reward/risk-ratio constellations: Algorithmic trading with the odds in your favor.
Key question: How do you know where the stock price will go?

The answer is easy: You don’t and we do not know it for certain either; however, we can help you with algorithms that find institutional engagement and thus produce high probability trade setups, indicating where a price move initiates, will go to, and where it might turn.
By using vector graphics and real time data, our slogan is: Let the chart tell when to buy or sell!
NFLX Daily NeverLossTrading Top-Line Chart on January 6, 2017
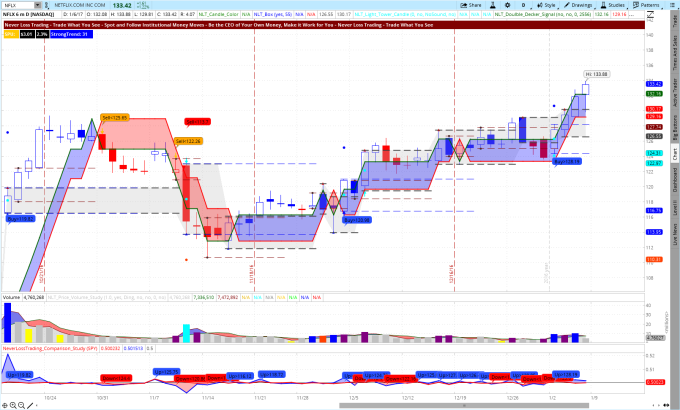
The NFLX chart has many details; most important, it spells out defined buy- or sell indications. In addition at each red- and blue signals, you find a set target to trade for: dot on the chart. The stop for the trade is either at a horizontal dashed line or at the red line on the chart, called the NLT Double Decker Stop Line (helps you to trail stops if desired).
In the top left corner of the chart, you see a dashboard, which is telling you our SPU-measure: An approximation of how far the bar-by-bar price move shall lead at trade entry, with the assumption that orange signals have a good chance to produce a 2-SPU price move after a maximum of 10-bars and thus, we did not paint a price target dot on the chart.
We teach in multiple hours, one-on-one, how to work with all chart details, trading strategies, a clear cut business plan (action plan and financial plan in our mentorships)…and more. Our training is focused and each session recorded: Highest learning efficiency at your best available days and times.
If this is for you: Call +1 866 455 4520 or contact@NeverLossTrading.com for more details.
Is it hard to read the chart?
Let us magnify the most important chart indications.
NFLX Daily NeverLossTrading Top-Line Chart on January 6, 2017
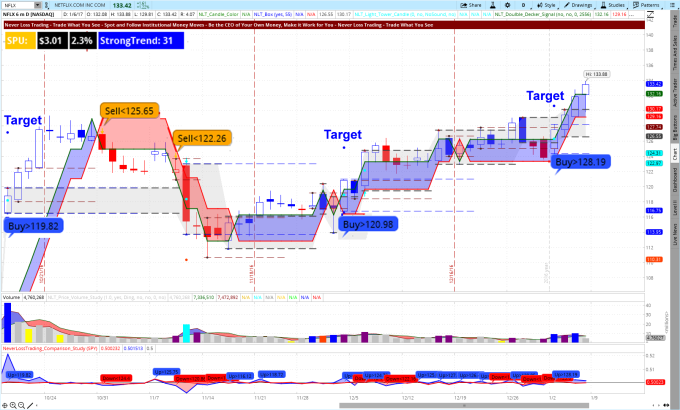
At the end of the day, all buy and sell signals indicated for NFLX produced positive results by exiting the trades at target and prior to the price direction changing again.
What do you do if holding stock positions overnight is not your thing?
You want to close your position at the end of the day and not worry about what can happen overnight!
Not a problem, we use fractal based algorithms that replicate their signals at all time frames and for all asset classes: stocks, options, futures, FOREX; just in this publication we refer to stock trading only.
Longer- and shorter time-frames can be easily combined.
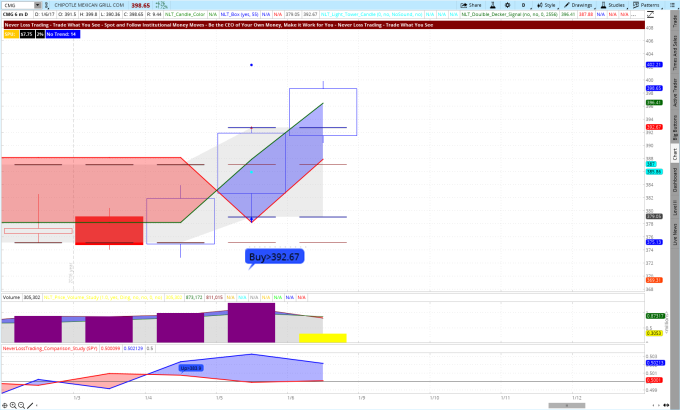
On our newly developed NLT Strong Movers Alert for January 6, 2017; CMG triggered a long signal. If you do not want to trade with the required risk for handling a daily chart, you can do the following:
- Scale down to a 20-minute chart.
- Take your trade Entry point from the daily chart: Buy > $392.67 (buy stop order).
- Set an open target by trailing with the red line on the chart or exit at bar number-5 of the same color series, or consider an exit after a 2-SPU move.
- The initial stop will go to the red line on the chart: NLT Double Decker Study ($390.09). Thus, your risk in the trade is: $392.67 - $390.09 = $2.58, while the daily chart required $13.62 of risk.
- To execute those trades on the regular, you need to fulfill day trading requirements, specified by the SEC: If you execute four or more day trades in a margin account, your minimum account holding has to be $25,000. Some smaller account holders get by, through splitting funds into multiple accounts (the day trading rule is measured per account).
- For shorting stock, which should be part of your executable trade action, a margin account and minimum holdings of $25,000 are required by the SEC rules.
To sign up for our free trading tips, alerts, and webinars...click.
CMG Daily NeverLossTrading Top-Line Chart on January 6, 2017 (signal on Jan. 5)
CMG Daily NeverLossTrading Top-Line Chart on January 6, 2017 (signal on Jan. 5)
Now you scale down to a 20-minute chart and you execute your trade on the lower time-frame, accepting a lower risk.
Let us jointly see where the trade ended. In our case, we exited the position at bar number five of the same blue candle color sequence: At $399.80 and produce a gain of $7.13, at an initial risk of $2.58.
In retrospect, you were trading with a 2.8:1 reward/risk-ratio.
Where does this lead to, if you constantly be able to trade at high probability trade setups with a positive reward/risk ratio?
You are trading with an edge, because you let the chart tell, when to buy and sell!
Let us zoom into the trade on a 20-minute chart:
CMG 20-Minute NeverLossTrading Top-Line Chart on January 6, 2017
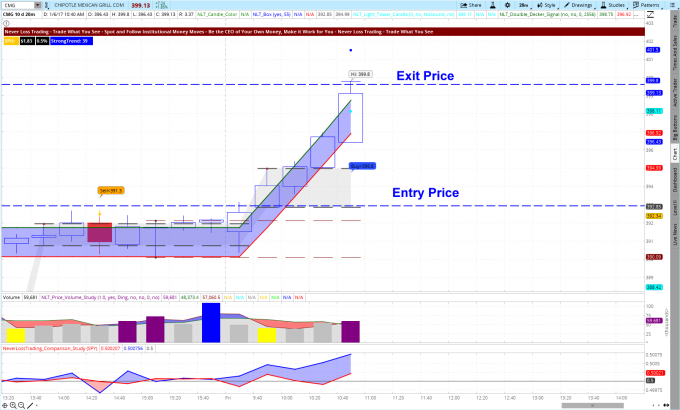
Trading like this without the NLT software on hand is kind of difficult: You see how the NLT-lines and entry indicators help a trader to specify the decisions right on the chart, with clear cut entries, exits, and stops.
We are offering multiple systems, take a look at our program offering…click.
The examples shared in this publication are from our elite program: NLT Top-Line. Allowing you a more budget entry into the world of high probability trading, we are currently offering a slightly scaled down version: NLT Top-Line Light (ask for the details).
Make a difference to your trading and experience in a live demonstration how our programs work: Call +1 866 455 4520 or contact@NeverLossTrading.com
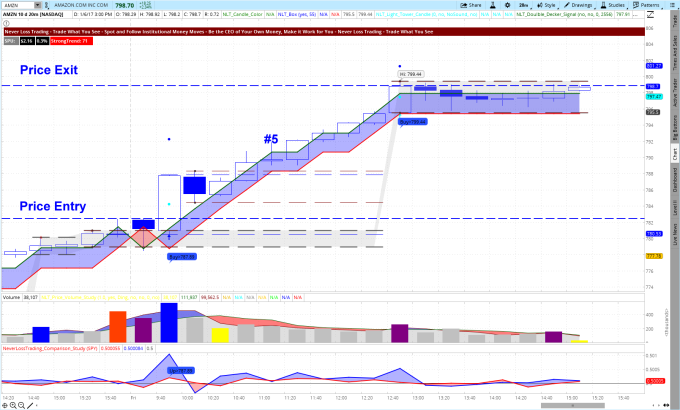
To demonstrate that CMG is not a single occurrence, AMZN had a buy signal for January 6, 2017: Buy> $780.40. Trading this occurrence from a 20-minute chart gave you a low risk entry: $1.92 risk, for a reward of $15.10: Trading NLT Light Tower to NLT Light Tower (one of our strong algorithmic chart setups); giving you a potential reward to risk of 7.8:1.
Where this leads to, explains itself; in particular when you combine the happening with high probability setups: You are trading with the odds in your favor.
Take a look at the AMZN 20-Minute-Chart and look for the price-entry and exit line. We also highlighted candle-#5 as a potential exit, while you were able to trail the stop to the next NLT Light Tower and take the exit at the blue-dashed line: Closing of the second NLT Light Tower in the sequence (NLT Light Towers are highlighted by a cyan dot).
AMZN 20-Minute NeverLossTrading Top-Line Chart on January 6, 2017
By teaching one-on-one, time and spaces are limited, so do not miss out:
Call +1 866 455 4520 or contact@NeverLossTrading.com
We are looking forward to hearing back from you.
Best regards,
Thomas

No comments:
Post a Comment