
In the fast-paced world of financial markets, traders are often bombarded with information, opinions, and predictions about where prices are headed. In the midst of this information overload, a timeless trading principle emerges as a guiding light: “Trade what you see.” This powerful philosophy underscores the importance of chart analysis and allowing the price chart to dictate your trading decisions. Paired with the innovative strategies of NeverLossTrading, this approach becomes an even more potent tool for success.

The Power of the Price Chart: A Window into Market Reality
At the heart of “trade what you see” is the belief that the price chart reflects market reality. Every price movement encapsulates market participants’ collective actions and sentiments. By honing in on the raw data provided by the chart, traders can tap into the true pulse of the market, free from noise and biases.
Chart Patterns: The Language of Price Movement
Chart patterns are the visual manifestations of market behavior, and we use multiple indicators and studies to make the action visible for you as a day trader, swing trader or longer-term investor. These patterns hold critical information about potential price movements. Each pattern tells a story—about potential reversals, continuations, or trend shifts. By training the eye to recognize patterns, traders gain an edge in deciphering the market’s intentions.
NeverLossTrading’s Chart-Driven Approach: A Game Changer
Enter NeverLossTrading, an innovative trading system that embraces the essence of “trade what you see:” Armed with proprietary indicators and strategies, NeverLossTrading’s chart analysis approach enhances this philosophy’s power. Here’s how:
- Objective Signals: NeverLossTrading generates objective buy and sell signals based on proprietary indicators. These signals provide clear, data-driven cues for entering or exiting trades, eliminating the ambiguity often associated with decision-making.
- Emotion-Free Trading: By relying on chart-driven signals, traders are freed from the shackles of emotion. Fear and greed take a back seat as traders trust the objective insights from the charts.
- Backed by Education: NeverLossTrading equips traders with education—a deep understanding of chart patterns, technical indicators, and strategies. This education empowers traders to not only see the charts but to interpret them with confidence.
- Risk Management: In pursuing “trade what you see,” risk management is paramount. NeverLossTrading integrates risk management techniques to safeguard capital, ensuring every trade is approached with calculated prudence.
- Adaptability to Trading Styles: Whether you’re a day trader, swing trader, or long-term investor, NeverLossTrading’s strategies can be tailored to your preferred style. The chart-driven approach transcends trading horizons.
Conclusion: Trading Clarity in an Information Storm
“Trade what you see” is a timeless trading mantra that resonates across generations. By allowing the price chart to guide your decisions, you tap into the essence of market behavior. NeverLossTrading takes this principle to new heights by infusing it with the power of proprietary indicators, objective signals, and comprehensive education. As you embark on your trading journey, remember that the charts are critical to unlocking trading success—clear, objective, and ever-reliable. It’s not about predicting; it’s about observing, interpreting, and acting with confidence. In the world of trading, where chaos can reign, the charts stand as your steadfast compass, pointing the way to profitability.
At this point, we best add some examples where we introduce the NLT decision-making principle:
Let the chart tell when to buy or sell!
For longer-term decisions, we use weekly charts. Swing trading decisions derive from daily charts, and for day trading, we mainly focus on what we call timeless charts: trading price-action oriented.
Swing Trading Example
The daily NLT Top-Line chart specified the entry, exit and stop of the trade:
- Buy signal on August 21, confirmed on August 22
- Entry > $232.13 (buy strategy)
- Exit (target) at $252.50
- Expected time in the trade: maximum of ten trading days, and the trade closed after six trading days
- Stop or price adjustment level at 220.50
- Either stocks or stock options according to the NLT Delta Force concept were traded
TSLA, Daily NLT Top-Line Chart
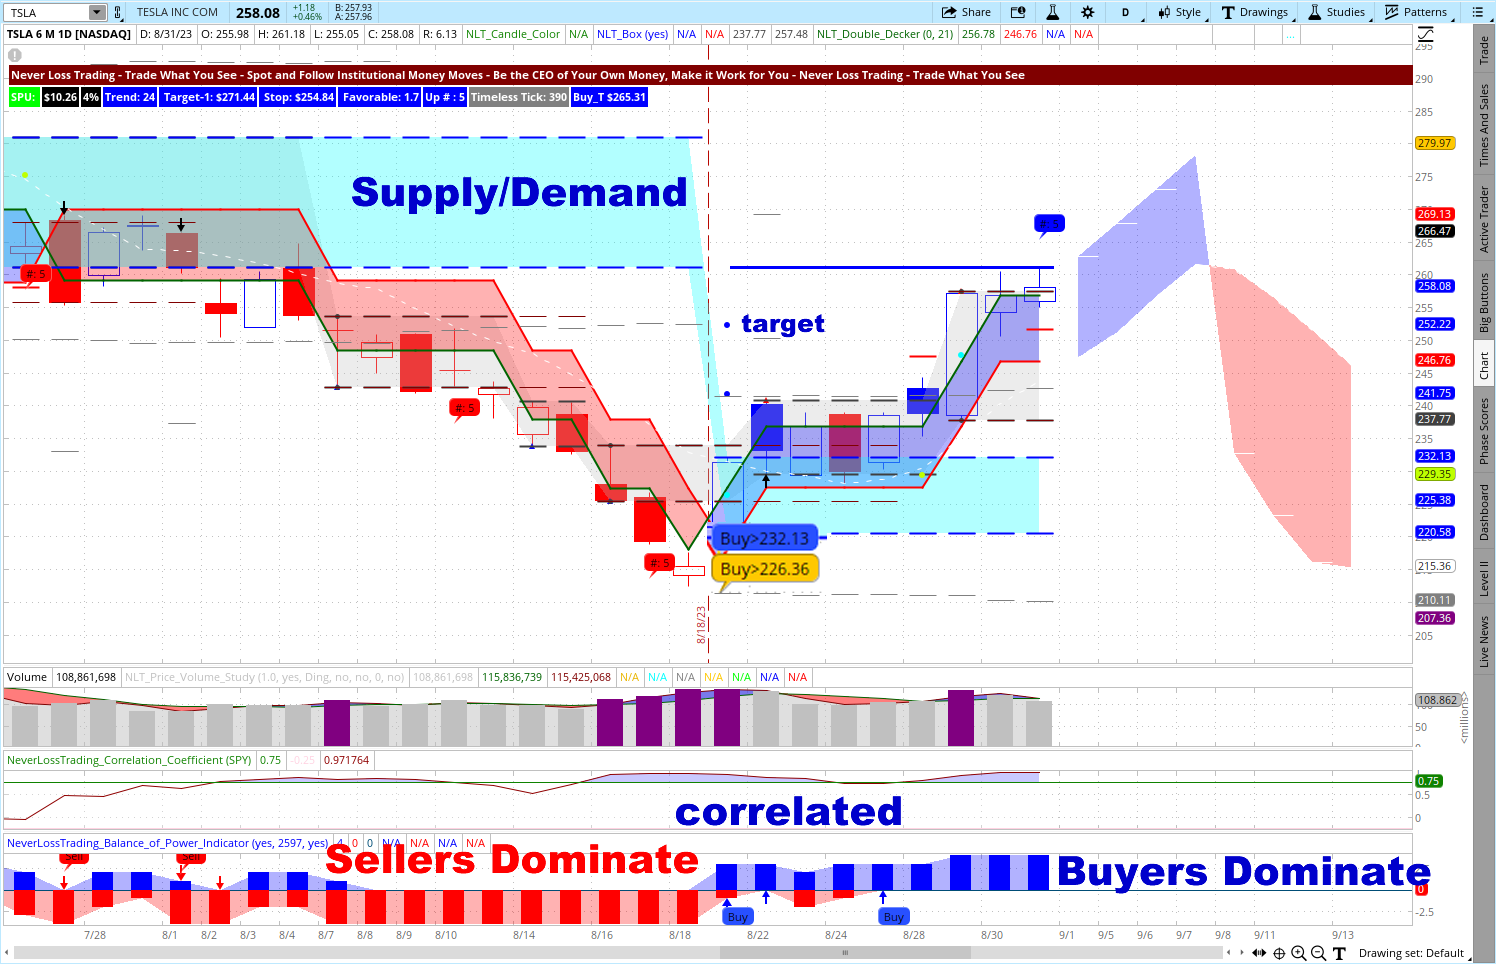
On August 21/23, two of our NLT Top-Line indicators printed buy signals on the daily chart:
- NLT PowerTower (Blue)
- NLT Bottom Reversal (Orange)
The direction of the buy signals was confirmed by the price movement of the next day (August 22, 2023) and offered going long in the stock. The chart further shows price zones highlighted in cyan, which indicate where we expect intense exchange and exit positions when we get to such zone border. A bottom study shows who is in charge (buyers now, prior sellers) and indicates that TSLA is moving with the overall market.
We hope this demonstrates how to let the chart tell when to buy or sell. Take the chance and experience in a life session what our systems can do:
contact@NeverLossTrading.com Subj. Demo
Longer-Term Investing
Let us now take the same approach and what you learned to discuss how longer-term opportunities unfolded on a weekly chart:
TSLA, Weekly NLT Top-Line Chart

The chart shows three candles, highlighted by NLT Signals: Two directional signals were confirmed and came to the system-set target (dot on the chart).
- Buy > $252.42 led to a trade in the week of June 12/23
- Buy > 240.82 led to a trade in the week of August 28/23
Both trades reached their targets.
The bottom study highlights when buyers or sellers were in charge of the price movement.
Day Trading Example
Our preferred way of day trading is purely price action-oriented: candles are not drawn time-based, but price-based, which specifies the concept’s name: NLT Timeless Trading. The chart shows multiple trading opportunities in the August 28, 2023, day session: two long and one short. In the example, we acted on the short signal, and the trade auto-closed after about six minutes.
E-Mini S&P 500 Futures Contract, August 28, 2023

The same day, we acted on another opportunity. The chart shows multiple signals, and we will teach how to determine which signals to act in our training and coaching sessions. Again, you see the time stem of the trade, and we always base our examples on trading one contract to give you a relation to the income basis: August 28, 2023, was $512.50.
E-Mini S&P 500 Futures Contract, August 28, 2023

Dots on the chart identify the exit, and red crossbars the stop.
There is undoubtedly much more to explain and show, so take the opportunity to experience in a life session how to act by letting the chart tell when to buy or sell:
concatct@NeverLossTrading.com Subj.: Demo
Our Offer
We help our students simplify technical analysis by providing a holistic approach that combines chart patterns, trend analysis, and market indicators. Traders are equipped with practical tools and methodologies to identify high-probability trade setups, helping them make informed decisions based on market trends and price action.
Subscribe to receive our trading tips.
Executing trades at the right time and price can be challenging, especially in fast-moving markets. NeverLossTrading offers techniques for precise trade entries and exits, allowing traders to capture optimal returns. With its focus on high-probability setups and systematic approach, NeverLossTrading helps traders improve their trade execution and timing, maximizing their profit potential.
The financial markets are dynamic and ever-evolving, requiring traders to stay updated and continuously learn. NeverLossTrading promotes a culture of continuous learning, providing educational resources, webinars, and personalized mentoring. Traders gain access to a wealth of knowledge and expertise, empowering them to adapt to changing market conditions and enhance their trading skills.
Trading challenges are an inherent part of the financial markets, but with the solutions offered by NeverLossTrading, traders can overcome these hurdles and thrive in their trading endeavors. By addressing emotional biases, providing effective risk management techniques, simplifying technical analysis, optimizing trade execution, and fostering continuous learning, NeverLossTrading equips traders with the tools and knowledge needed for success. Embrace the solutions provided by NeverLossTrading and embark on a journey toward consistent profitability and trading excellence.
To succeed in trading, you best work with an experienced coach. Our #1 competitive advantage is the support and customer service we offer. Veteran traders have been through more ups and downs than you can imagine. So, experienced pros have probably experienced whatever you’re going through. If you are ready to make a difference in your trading. We are happy to share our experiences and help you build your trading business. Trading is not a typical career, and you best learn from those who are long-term in this business to cope with the rollercoaster of the financial markets. We are here to help and provide feedback on what you might be doing right or wrong. Strive for improved trading results, and we will determine which of our systems suits you best. The markets changed, and if you do not change your trading strategies with them, it can be a very costly undertaking. Hence, take trading seriously, build the skills, and acquire the tools needed. Trading success has a structure you can learn and follow.
Thomas Barmann (inventor and founder of NeverLossTrading)
Disclaimer, Terms and Conditions, Privacy | Customer Support

No comments:
Post a Comment