After Berkshire Hathaway Inc. declared horrible earnings last May 2, 2020, our long-term investors asked us about investment opportunities in 2020. Trading the markets day-by-day, we are wondering about the hype of Berkshire Hathaway Inc. Comparing BRK/B to SPY shows, from the end of December 2019 to May 1, 2020, BRK/B was underperforming the SPY (ETF of the S&P 500 Index).
SPY Compared to BRK/B on a Daily Chart, December 2019 to May 1, 2020 So why would you want to put your money where the fund manager cannot outperform the index?
In essence, learn to trade and invests with a high probability system, then you have the chance to outperform the index. The choice is yours!
Helping our clients to find future investment opportunities, we put together a list of prospects, while on today’s basis, market conditions are pre-mature to invest in those. However, a good investor is prepared when the right conditions arrive.
Following the NeverLossTrading principles, we want a confirmed trading signal on either a daily, weekly, or monthly basis. Then and only then will we be ready to take a position.
Another question we were asked: If one does not want to invest in one single stock but rather into a family of the same shares through one type of investment, which ETF would we choose?
Making it simple, we put our opinion into the following table: For the week fo May 4, 2020, our NLT Alerts spelled out multiple short opportunities too, and we are ready to act, condition to confirmed signals.
By the NLT principle, we will only trade when other market participants react to the observed change in supply or demand, by driving the price to the level of our pre-spelled out price threshold. When this happens, buy-stop or sell-stop orders will be executed, and our offer goes to an exchange or limit orders in case of working with options.
Just write us an email with the Subj: Free NLT Stock Alert, include a legit name, and you will find the NLT Stock Alerts in your inbox.
All our decisions are chart based, where price thresholds spell out the opportunity for you. AAPL Monthly NLT Top-Line Chart: October 2017 to April 2020 You see five highlighted situations that we analyzed: Watch the video for further details and examples...click.
Trade as mechanical as possible with clear cut rules.
For getting those charts and learning to participate in such opportunities:
Can one trade longer-term price developments in times of COVID-19?
To answer this question, let us define longer-term trading first. By our definition, longer-term trades take their signals from weekly and monthly charts, assuming to hold positions for multiple weeks or months.
The key to longer-term trading as it is to shorter-term trading:
Finding assets in demand or supply, and trading along with their price development with a risk-limiting strategy.
When you are just long or short stock, you are not trading risk limited: stocks can lose 50% of their value in a very short period of time. Check out BA, for example: The share dropped 50% of its value in a matter of two months.
In trading, we predict price developments, but cannot control them:
We work under a probability assumption, but we can control the risk we take per trade.
However, risk control is easier said than done. We offer multiple strategies in our mentorships, teaching you to execute risk-limiting trades that are applicable for all account types: Cash, IRA, Margin Accounts.
How to find and follow a potential price move?
It is the duty of your system: It shall help you to find underlying changes in supply and demand, paint those on your charts, and to give you market scanners that let you find those opportunities without the need for going through hundreds of charts.
Let us start out with a monthly chart example where the NeverLossTrading Top-Line system speller out multiple directional trading opportunities by upper- and lower study indicators.
AAPL Monthly NLT Top-Line Chart: October 2017 to April 2020 You see five highlighted situations that we analyze in detail for you.
Situation
Actions
Situation-1
Long trade by the price threshold: Buy > $190.37, being surpassed in the next candle. Trade for a maximum of five bars or to the price target. The trade started in an NLT Light Tower and ended there (candle with the cyan dot).
Situation-2
No trade, not supported by the lower study.
Situation-3
Long trade for a maximum of five bars or exit at the NLT Box Line.
Take your chance and experience in our free video (only up for short), how to apply a systematic approach to your stock trading activities; reaching from:
Day Trading, through Swing Trading, to Long-Term Investing.
Including strategies to decide for IRA and 401(k) investments… all covered in a 25-minute video…click here.
Decades of knowledge prepared to share.
Experience a systematic to tell, when to buy or sell.
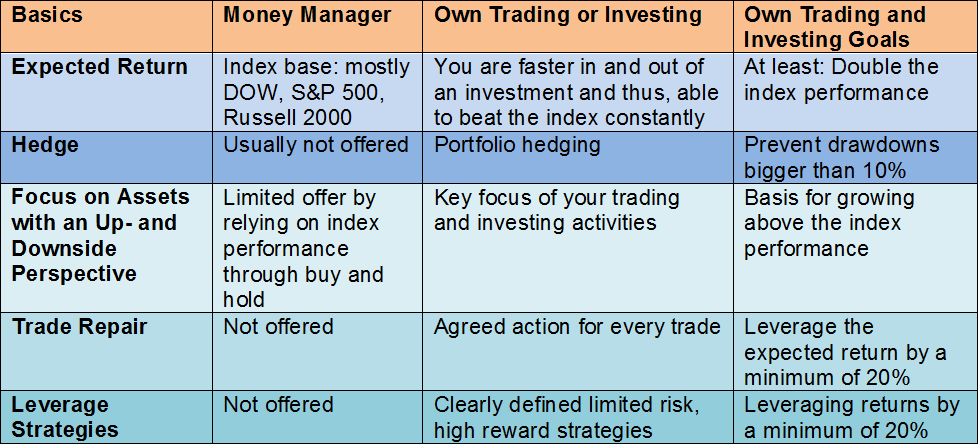
In a short overview, this is what you can expect from a money manager and from you as a private investor:
Goals of IRA’s with Money Managers and as a Self-Investor Instruments Needed to Beat Money Managers Index Performance
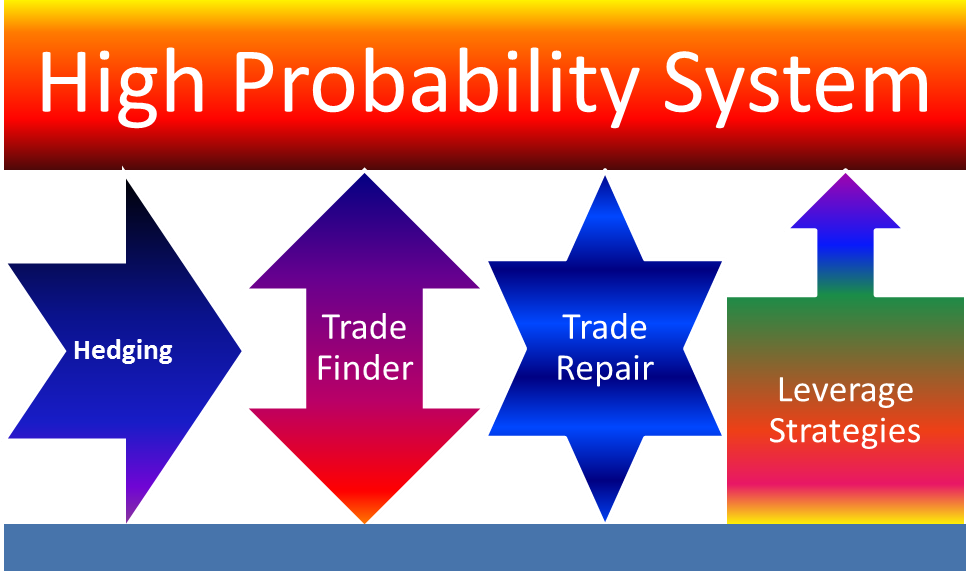
Operate with a high probability trading system that is able to highlight institutional engagement on the chart: A change in supply and demand is measurable as a pre-stage for a potential future price move. Aim for a predictability ≥ 65%.
To prevent drawdowns, apply a hedging strategy: In 2008, the stock market dropped 50% in a matter of months; hence, you are in need of a hedging strategy, which protects you even overnight, when the stock markets are closed, letting you find sound sleep – IRA managers do not offer such!
Find assets with up- and downside price move potentials (trade finder): Invest where prices move (even in an IRA).
Instead of taking a stop-loss, repair your trade: Imagine you trade 100 times per year, with a one dollar reward and a one dollar risk per trade. When you win 65 and lose 35 trades, your balance is $40. By applying methods of trade repair, you have a high chance to reduce the average loss to 40% of the originally planned loss (and you can do better). Applying our method of trade repair will then increase your gains by $21, giving you a potential for a 53% increase on your return. How does that sound?
Leverage strategies: Build up your opportunities when they matter: Add to your winners and harvest big and keep the losers small – your key principle of trading and investing success.
Contact us for a personal consulting hour where we can show you how our systems and education modules work: We are in business since 2008 and work one-on-one with our clients to build all mentioned elements and more to a guideline for trading and investing success. Today, we offer you two choices:
We are all driven by emotions; however, when it comes to trading and investing, you should give yourself rules on which you act and not believes.
What are the dominant emotions driving private investors? Fear and Greed.
The fear of losing, paired with the greed of missing out on an opportunity.
When the Bitcoin was on the hype, I had many who asked for a quick tip – and my answer was: stay out; when the average person starts knowing about an opportunity, it is over and somebody needs to buy at the high – let it not be you.
On a recent advertisement for a trading system that is around since long, the following trade proposal was propagated for AAPL, trading with Vertical Put-Spreads:
Maximum profit: $1,100
Maximum loss: $1,900
When we calculate the outcome based on different probabilities over 10-trades, you will immediately see that the odds are not much in your favor, even so, the trade was proposed based on the idea that you make money if the share price goes up, moves slightly down, or goes sideways.
10 Trades
Win/Loss
50:50
60:40
65:35
Reward
1100
-4000
-1000
500
Risk
1900
Sure, AAPL is a great company with products we love, but we want to encourage you: stop falling in love or being emotional with investments. At a 65% probability to predict the future, you should not only reach breakeven, you should make money!
A simple basic rule for making money trading: The odds of the trade setup need to be in your favor and you need a system that helps you to predict the future with a high probability.
There are not risk-free trades, and the idea that you can find trades that have a more than two-times the reward, compared to the risk to take, are rare: about 5% to 10% of the opportunities we record. Hence, you are doomed to somewhere trade in the area of a 1:1 reward/risk.
How to make money this way?
By following a system that gives you high probability trade setups ≥ 65%, applying clear cut money management and risk management rules.
Sounds simple, doesn’t it?
It all starts with a system that records the price action of now and proposes when money is flowing in or out of an asset. For you to be part of the directional move, the system shall measure the potential price expansion, the statistical volatility (where to place the stop) and the maximum time in the trade: rule-based trading and investing.
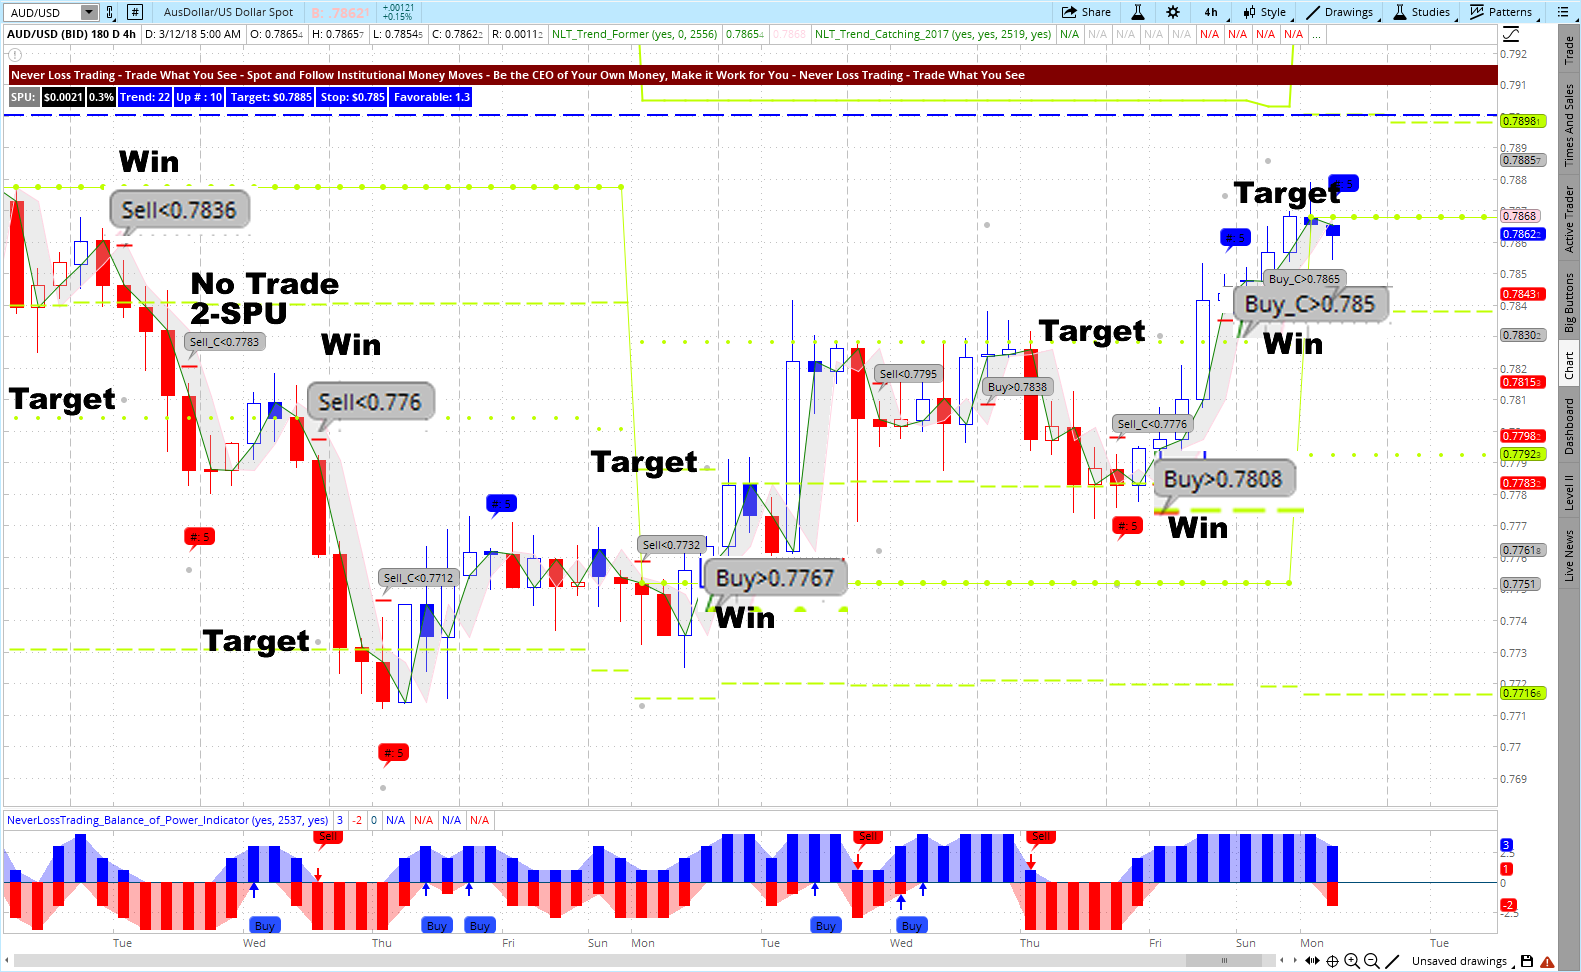
The following examples show, how we initiate trades with buy-stop orders or sell-stop orders when the formulated price threshold is surpassed: Sell<0 .7836="" a="" additional="" apply="" at="" available="" best="" by="" candle.="" chart.="" development="" dot="" e.g.="" find="" gray="" in="" is="" next="" of="" on="" one-on-one="" p="" price="" red-cross-bars.="" rules="" stop="" surely="" target="" teach="" the="" times.="" we="" which="" your=""> AUD/USD NeverLossTrading TrendCatching Example
Each of the highlighted trade situations allowed for an about 25 pip price move to target at a similar risk.
Let us demonstrate rule-based trading on a stock example:
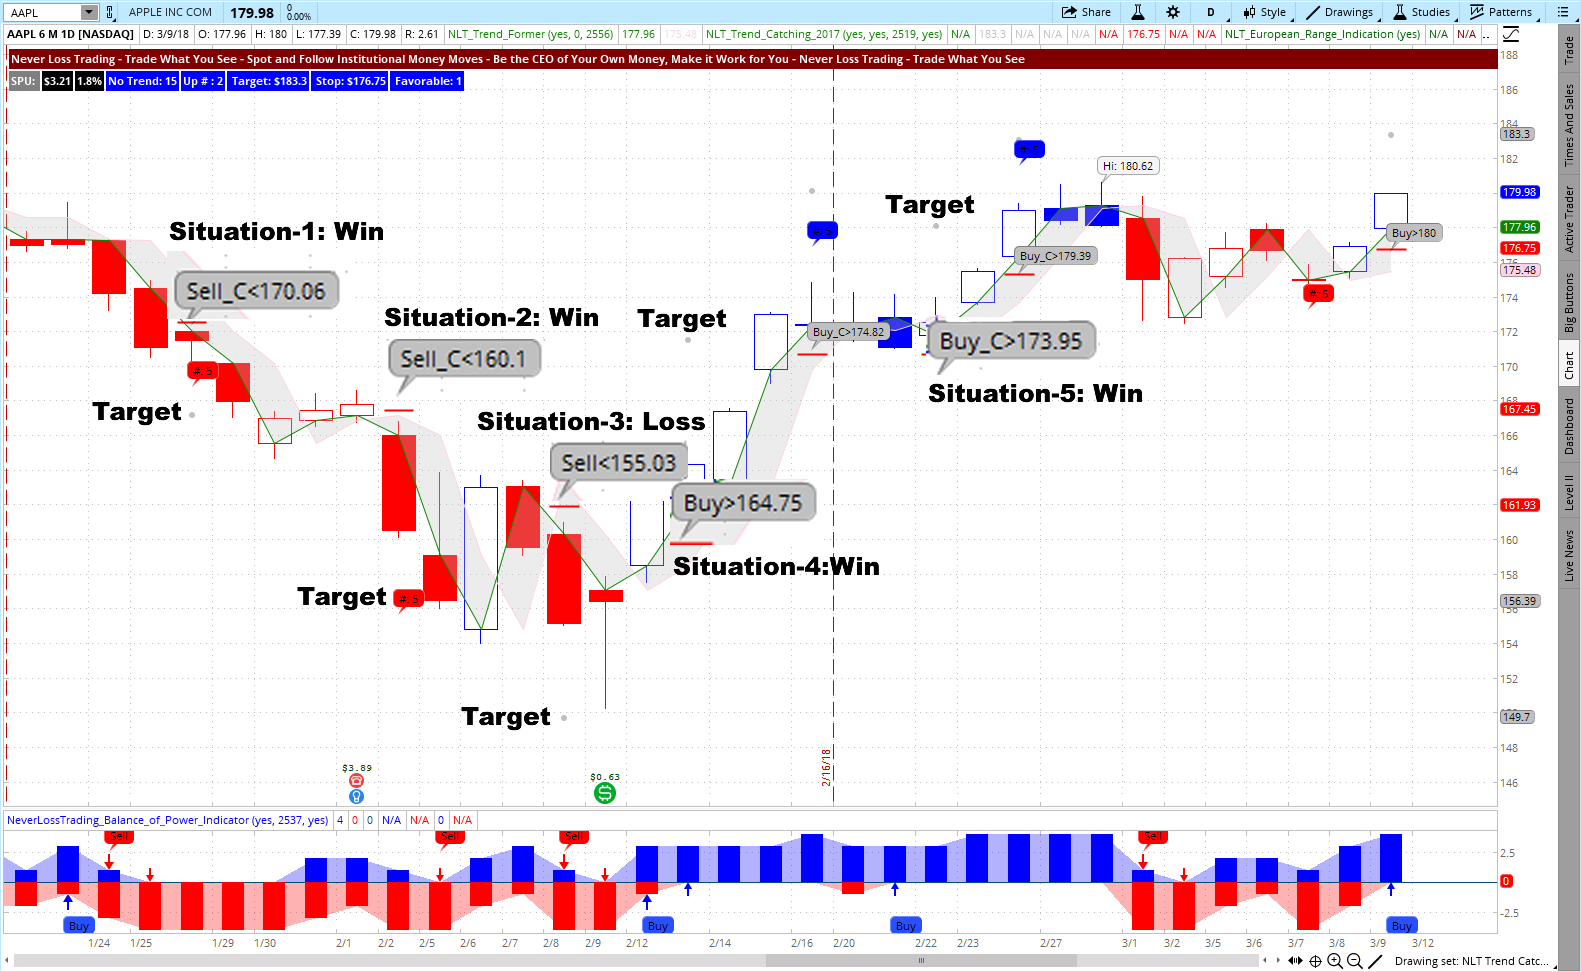
AAPL NeverLossTrading Daily TrendCatching Chart
In five trade situations, we had four winning trades and one loss: high probability!
At each situation, the trade target was formulated and so was the stop. Only trades that were according to our reward/risk rule were accepted.
When you want to learn rule-based trading, we are happy to work on a live demonstration with you, where you can experience how our systems work at your preferred assets and time frames.
If you want to know what is needed to turn you into the trader or investor you want to be, listen well and read the following documentation.
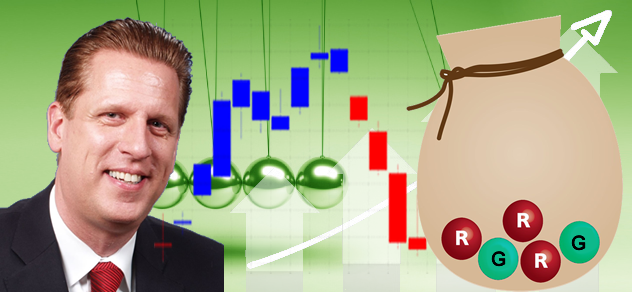
At times, we play a high probability game, where we let people bet on a draw of marbles from a bag. In a bag of 20 marbles and we put marble back after the draw, keeping the same ratio:
13 green marbles that win.
7 red marbles that lose.
Thus, you have a high chance of winning; however, watch the video or read on to experience what happened in reality.
The shocking results:
Starting out with a paper money account, after 20 games, 60% of the people had less money than they started out with; 30% in average even went broke.
Statistically, how many people should have made more money than they started out with?
To answer this, we rely on the Bernoulli-Experiment, which gives us after 20 draws an expectation that 87.8% of the participants, using a 65%-probability to win, should have made more money than they started out with.
Why did this not happen?
Making money requires risk management (appropriate risk per trade), money management (position sizing) and more. If you do not have those skills in your repertoire, you most probably end up not having a chance to produce the returns that you expect.
However, the financial markets do not offer you easy and equal opportunities. The pros are prepared to take your money.
When you trade or invest, the ones who accept your trade are prepared to win; minimizing your chances for positive results. Institutions dominate the game and when you want to enter into a professional business, you better be prepared.
This is where we can help you to turn yourself into the trader or investor you want to be.
We provide you with high probability trading systems: ≥65% likelihood to project strong directional price moves, with the required training and coaching to let you act as mechanical as possible, playing par-to-par with the pros, with the odds in your favor.
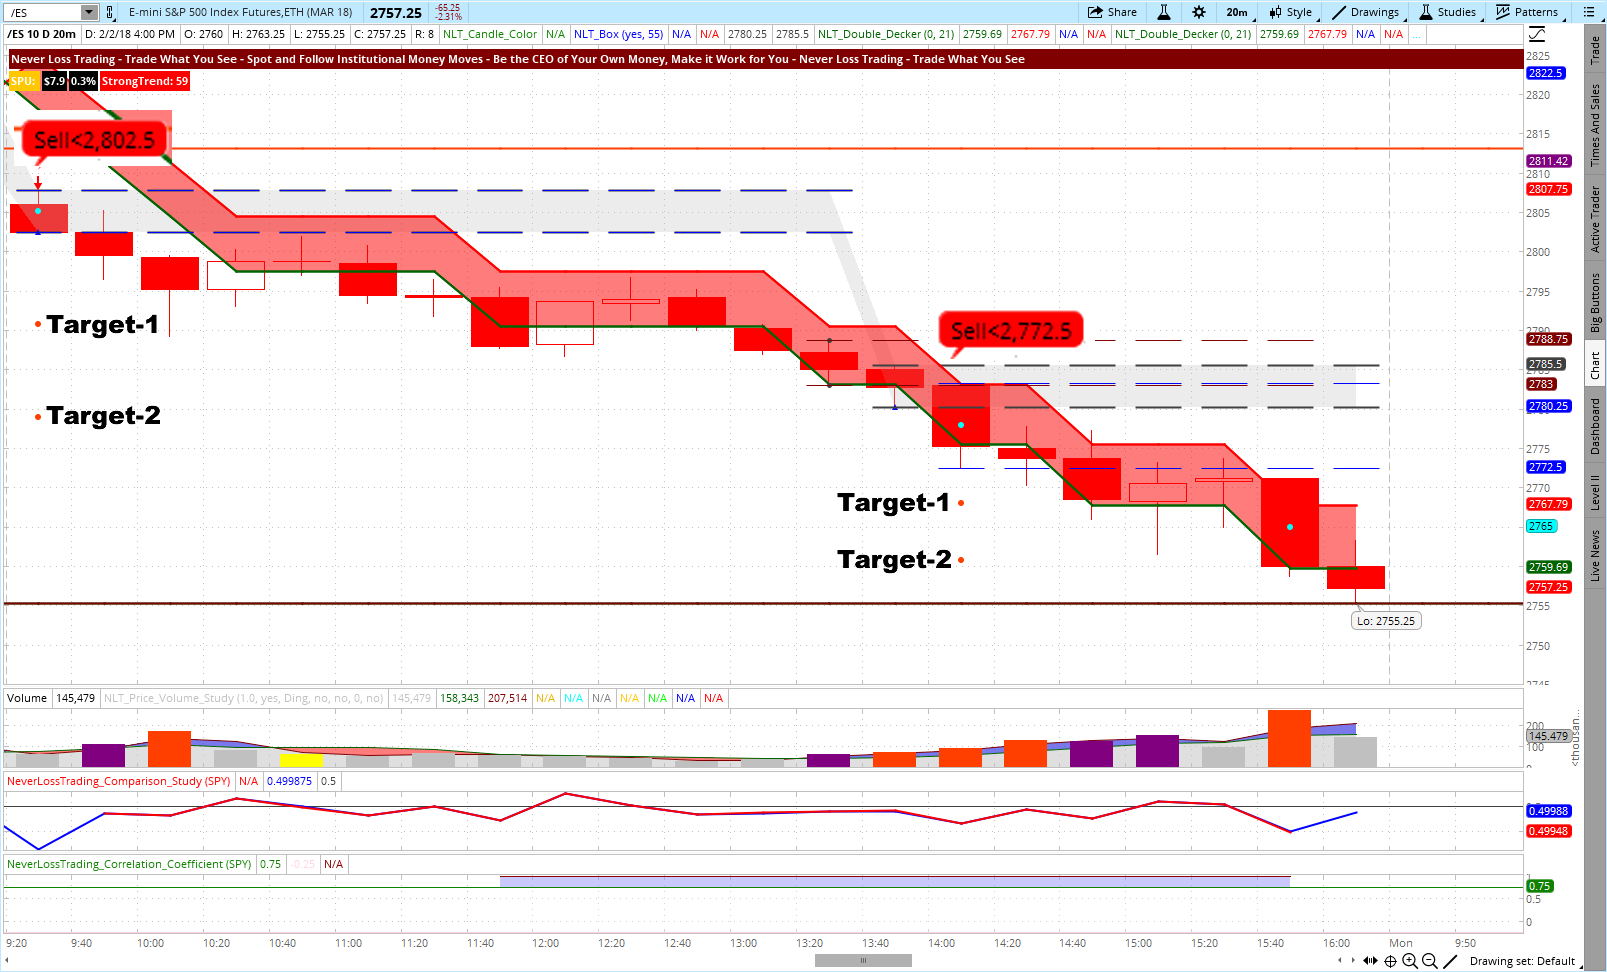
Let us pull up a chart and see if you would be able to follow those signals:
E-Mini S&P 500 Futures, February 2, 2018, 20-Minute Chart
One of our key slogans is: Let the chart tell when to buy or sell!
Do you use a system and does it provide you with the same (clear cut entries, exits, and stops)?
When you learn to trade and invest the NeverLossTrading way, you get this:
Follow high probability trade setups to the up and downside, with pre-defined entries, exits, and stops or price adjustment levels.
Learn one-on-one at your best available days and times.
Apply a business plan for trading success:
Financial plan: Expected return based on the number of trades or investments per time-unit.
Action plan: How to prepare for your trades to conveniently even act when conditions are met; without the need of being in front of your computer at entry or exit.
Getting all signals, scanners and more installed into a free real-time database.
Make risk management and money management a daily action, preventing drawdowns and appropriate risk acceptance.
Apply multiple trading strategies based on the actual setup…and more (see below).
Does that only work for day trading?
Absolutely not: Our systems identify price move potentials at:
Pre-stages of a price move.
Initiation stages.
Continuation stages.
AAPL Swing Trading NeverLossTrading Top-Line Chart, January 1 to February 2, 2018
However, the system alone does not necessarily get you to where you want to be, and this is where we help you, with one-on-one training and coaching.
We hope you see now that many gears have to cut into each other to give you the chance to take money from the financial market's long-term.
In a short summary: Answer for yourself if you already have everything in place, starting with a high probability trading system: Probability to predict future price moves with a higher than 65% likelihood, considering the following:
Overview of what it takes to be a Trader or Investor
Now that you see what it takes, the question is: Are you able to create this on your own or do you rather trust into a primer education provider (we are in business since 2008), who can help you to shorten your fairway to success: It took us more than 10,000 hours and more than 30 years of experience in putting it all together.
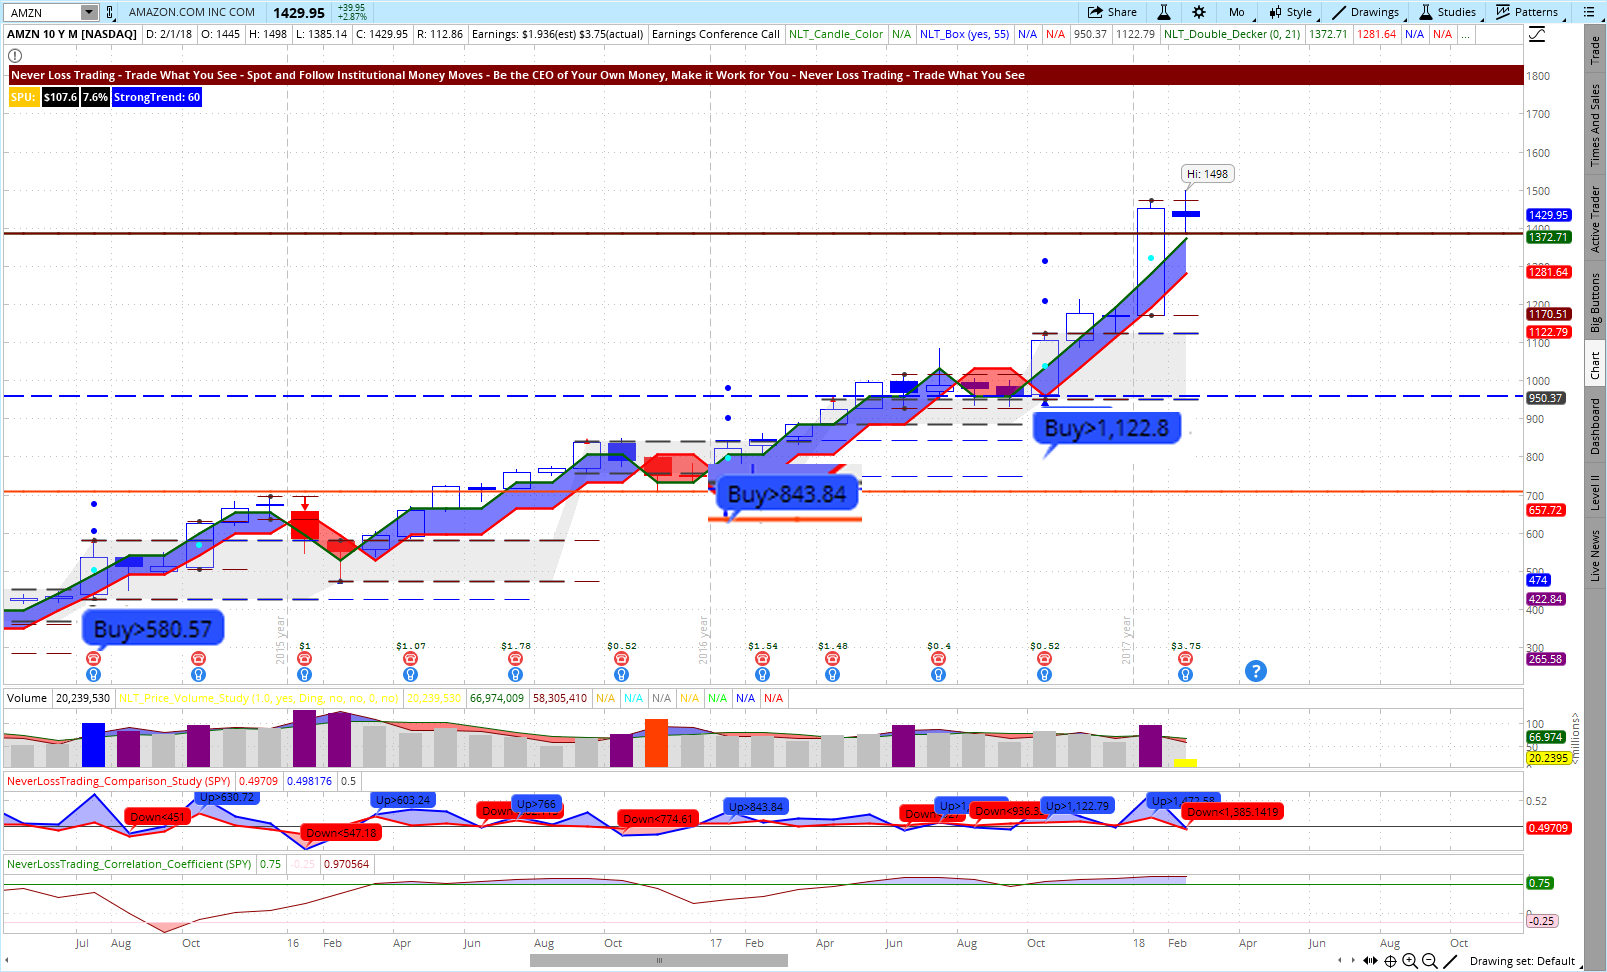
In case you do rather want to buy and hold positions, we can help you too. Take a look at the following chart:
AMZN NeverLossTrading Long-Term Investor Chart June 2015 to February 2018
If you like to learn how to act on clearly spelled out directional price move opportunities, take our offer and experience how our systems work live. Get a free demonstration:
Is fundamental analysis the basis of your decision making? Are you in the position to outsmart the world’s best analysts, working for companies like Goldman Sachs, Morgan Stanley, J.P. Morgan (just to name a few)? Let us be casual, you are most likely not!
As a result, technical analysis is the logical choice.
At this point, we immediately want to bridge over:
Imagine, one of this big institutional investment firms starts an action to collect or distribute an asset. In this case, other asset holders and market participants will recognize the action and either trade with or against what they notice. If you had an indication on hand, that such situation is there, you would be in the position to observe if specific price thresholds are surpassed to trade with a developing directional price move.
Click here to watch the video…click.
This is exactly what we do with the NeverLossTrading concepts. We do not squeeze the real market action into a mathematical formula like moving averages; we measure the action of now and formulate resulting price moves for all asset classes and time-frames and only act:
When the directional price move is confirmed.
When the odds are in our favor.
At pre-formulated entry-, exit, and stop levels.
With a plan-B, in case the trade goes wrong.
For a pre-formulated maximum time period.
With such system on hand, your chart is telling you, where the momentum and the trend are going and you can act by our key slogan:
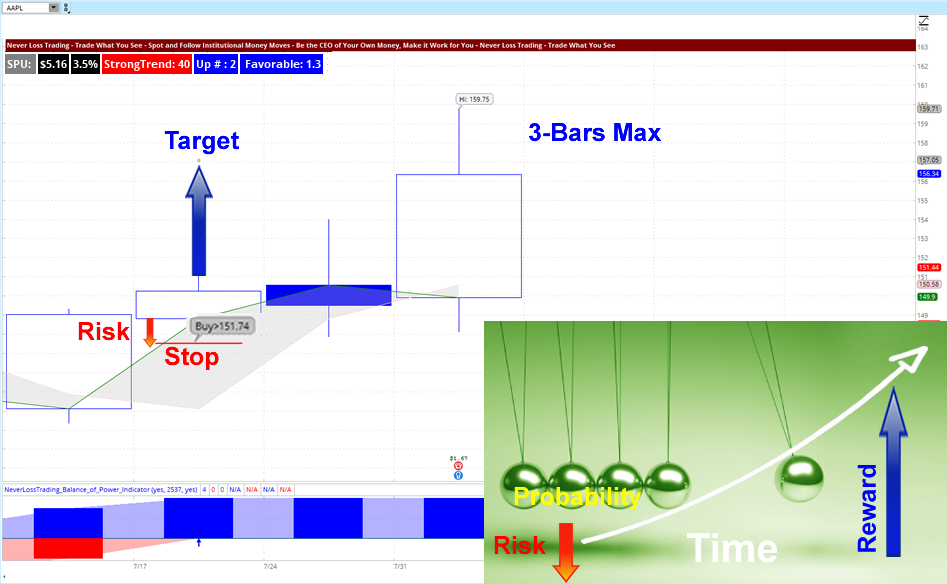
Trade What You See! Let the chart tell when to buy or sell. Chart-1: AAPL Weekly NLT Trend Catching Chart July/August 2017
Chart-1 shows a long-setup at the candle that closed on July 21, 2017 with the following components:
Buy>$151.74, if next week’s price development surpasses this threshold.
Stop or trade repair (plan-B), if the price drops to $147.20.
Exit at target of $157.07 or after three bars (in the example: three weeks).
Reward/Risk: 1.3-time the reward to risk (favorable – odds in your favor).
How did we come to predict such price moves?
Prior to a price change, we measure the underlying change in supply and demand and from there:
We extrapolate a price point to enter into a directional trade (buy-stop or sell-stop order).
Our system pre-formulates the exit point: target.
In addition, a stop or trade adjustment level is pre-formulated at entry.
Bringing those components together, we focus on high probability trading with attainment rates >65%, together with the imperative to apply a time-based exit: closing the trade if the expected price target is not reached after 3-bars.
You might say: That sounds like tape-reading and in a way, it is; however, with the most advanced algorithms, real-time data, server technology and vector graphics. A single person could never replicate what our computers can do.
Even so, we specify trading as mechanical as possible; we value the human element:
By teaching you pattern recognition and quick observation of key supply and demand levels on the chart.
By always trading with a plan-B, allowing you to repair trades instead of taking a stop-loss.
Thus, you are applying algorithmic trading with human interaction: a strong combination.
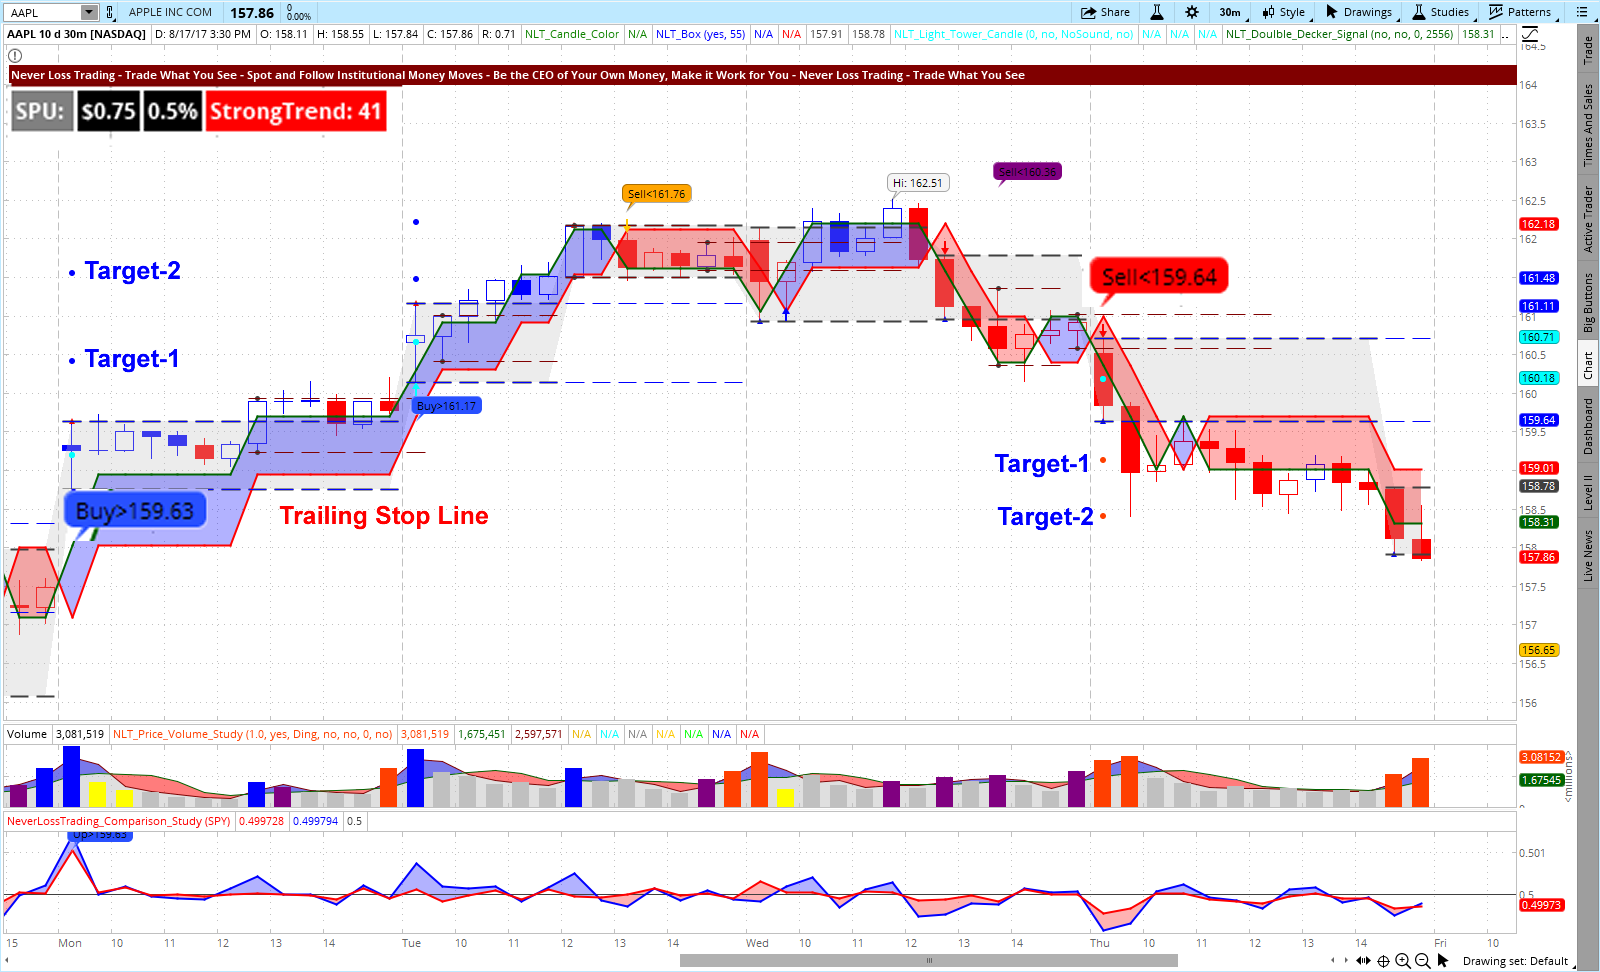
By teaching one-on-one and by providing longer-term coaching, we focus on your individual wants and needs; helping you to turn yourself into the trader or investor you want to be. Chart-2: AAPL 30-Minute NLT Top-Line Chart August 14 – 17, 2017
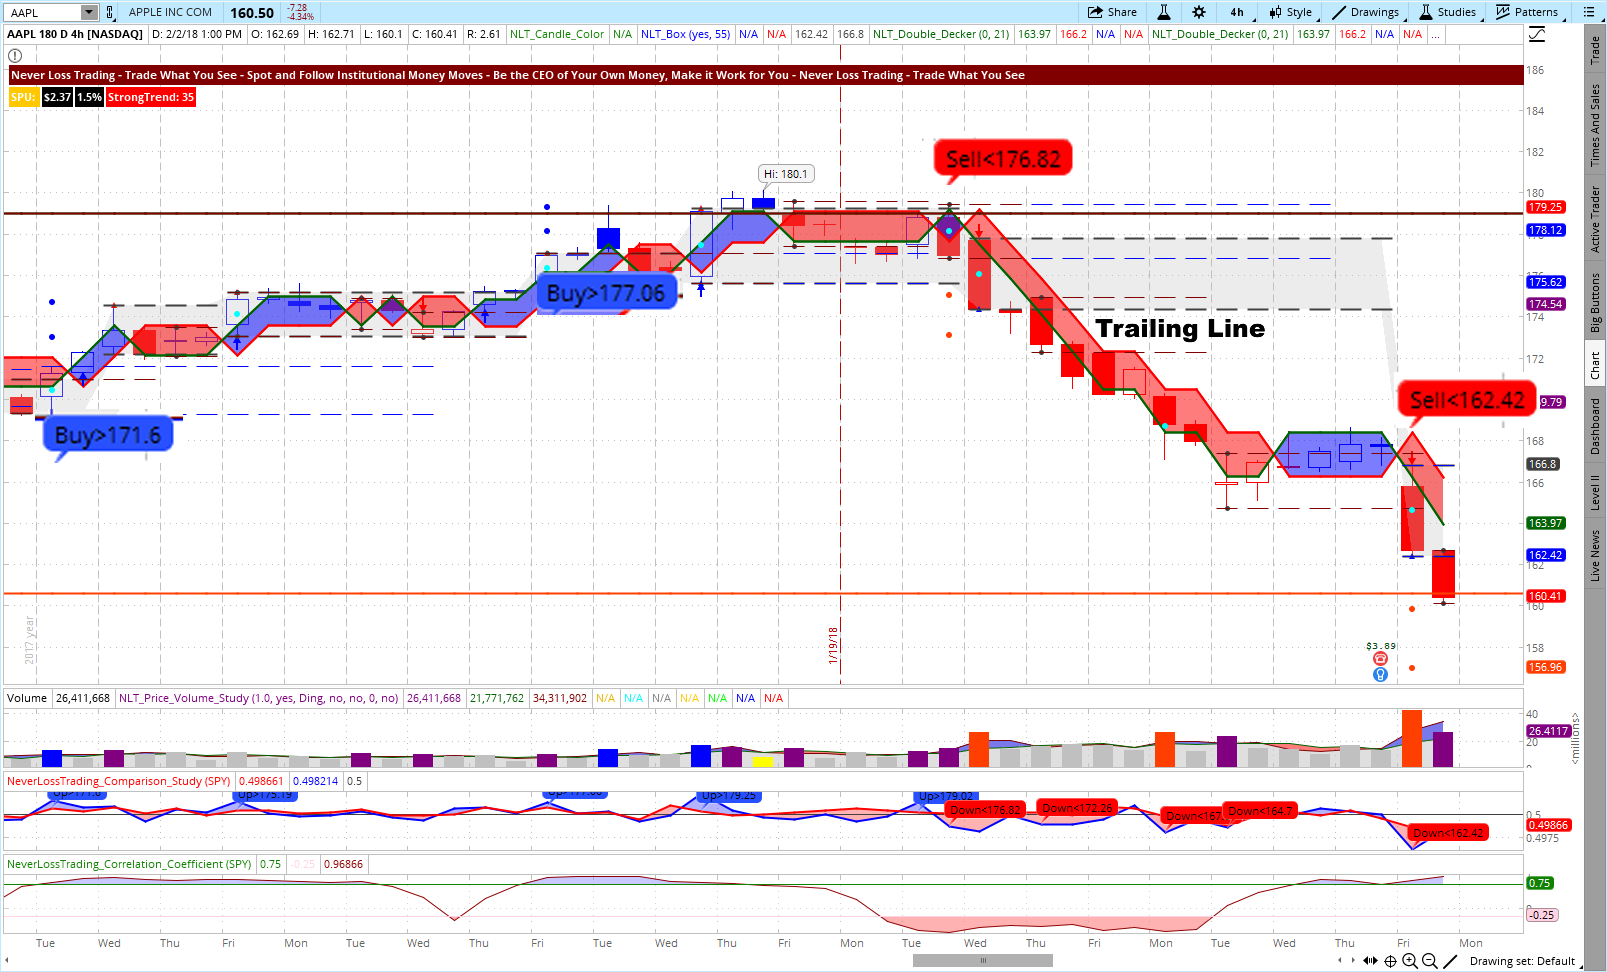
Chart-2 shows, how to trade short-term price developments with a two-tier target setting (the system works the same way for longer-term trades). Aside from placing the stop at the base of the red-line at entry, you can also trail your stop by following the red line, participating in the price-move from the beginning to the end.
To keep this short: If you like to trade long-term or short-term price moves, we can provide you with the system and algorithm that supports your trading style.
We tune our systems, training time and coaching, to fit your individual wants and needs; helping you to turn yourself into the trader or investor, you want to be.
We offer several systems and always teach one-on-one. We are in business since 2008 and dedicate our knowledge, passion and time to those we commit to. If you like to be one of the NeverLossTraders, call us or schedule an individual demonstration at:
When we work together, it is not only that you learn to read charts by our indicators and patterns, you will experience the following:
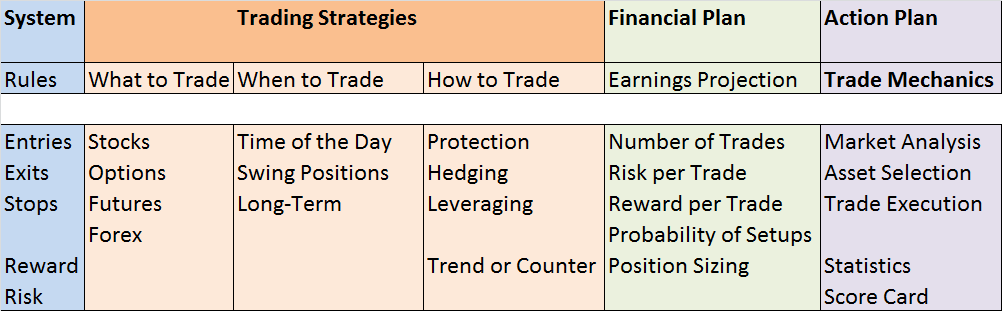
A business plan for trading success: Financial plan (which return to expect at your best available time) and an action plan (what to do when and how).
How to repair trades that go wrong, with the potential to turn losers into winners (this is where our name came from; however, Never Stop Loss Trading was lengthy).
How to hedge and leverage your holdings, making the additional income you deserve and prevent draw downs.
Trading or investing with multiple strategies and only when the odds are in your favor.
Option trading strategies, capturing risk and escalating returns at all asset classes.
Clear cut trading plan, with chart-based entries, exits, stop or adjustment levels.
Learning at your best available days and times.
Coaching until you get independent and free.
High probability trading at or above 65% probability for success.
Clear cut documentations for every system and trade setup (NLT Tutorials).
Recorded learning session for an easy repeat on any device until the learned sits.
This and more is what you find in the NeverLossTrading mentorships.
If you feel, this is for you:
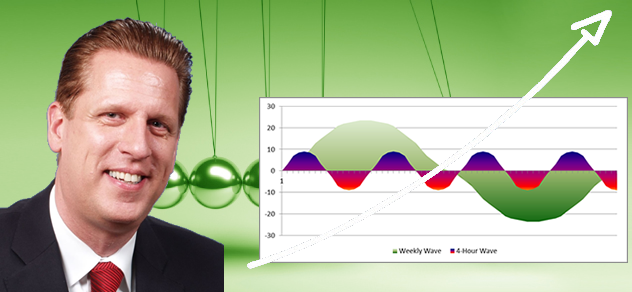
By our research, NLT weekly chart signals translate with a very high congruency into 4-hour trading opportunities. We do that as follows:
Weekly signals go on the four-hour watch list and are traded independent when an NLT signal occurs and is confirmed. See the wave coupling chart on the intro picture. With the NLT systems, you obtain a scanner alerting you and you also learn how to set chart alerts that go to text or email.
With the NLT trading method, you only trade when other market participants confirm the indicated trading direction.
Last week, we informed our students and subscribers that based on the current earnings declaration period, we rather prefer short-term to longer-term stock engagements and thus, put the following signals on our 4-hour watch list:
GM
FB
V
HPQ
To limit the number of charts to show, we measure the 4-hour trade performance based on NLT TrendCatching signals.
Trading Results 4-Hour Chart for Weekly NLT Trend Catching Signals
In case this table is hard to read, we had the following signals and attainment:
GM (no signal – no trade)
FB: one signal and a 0.9% return on cash in one day
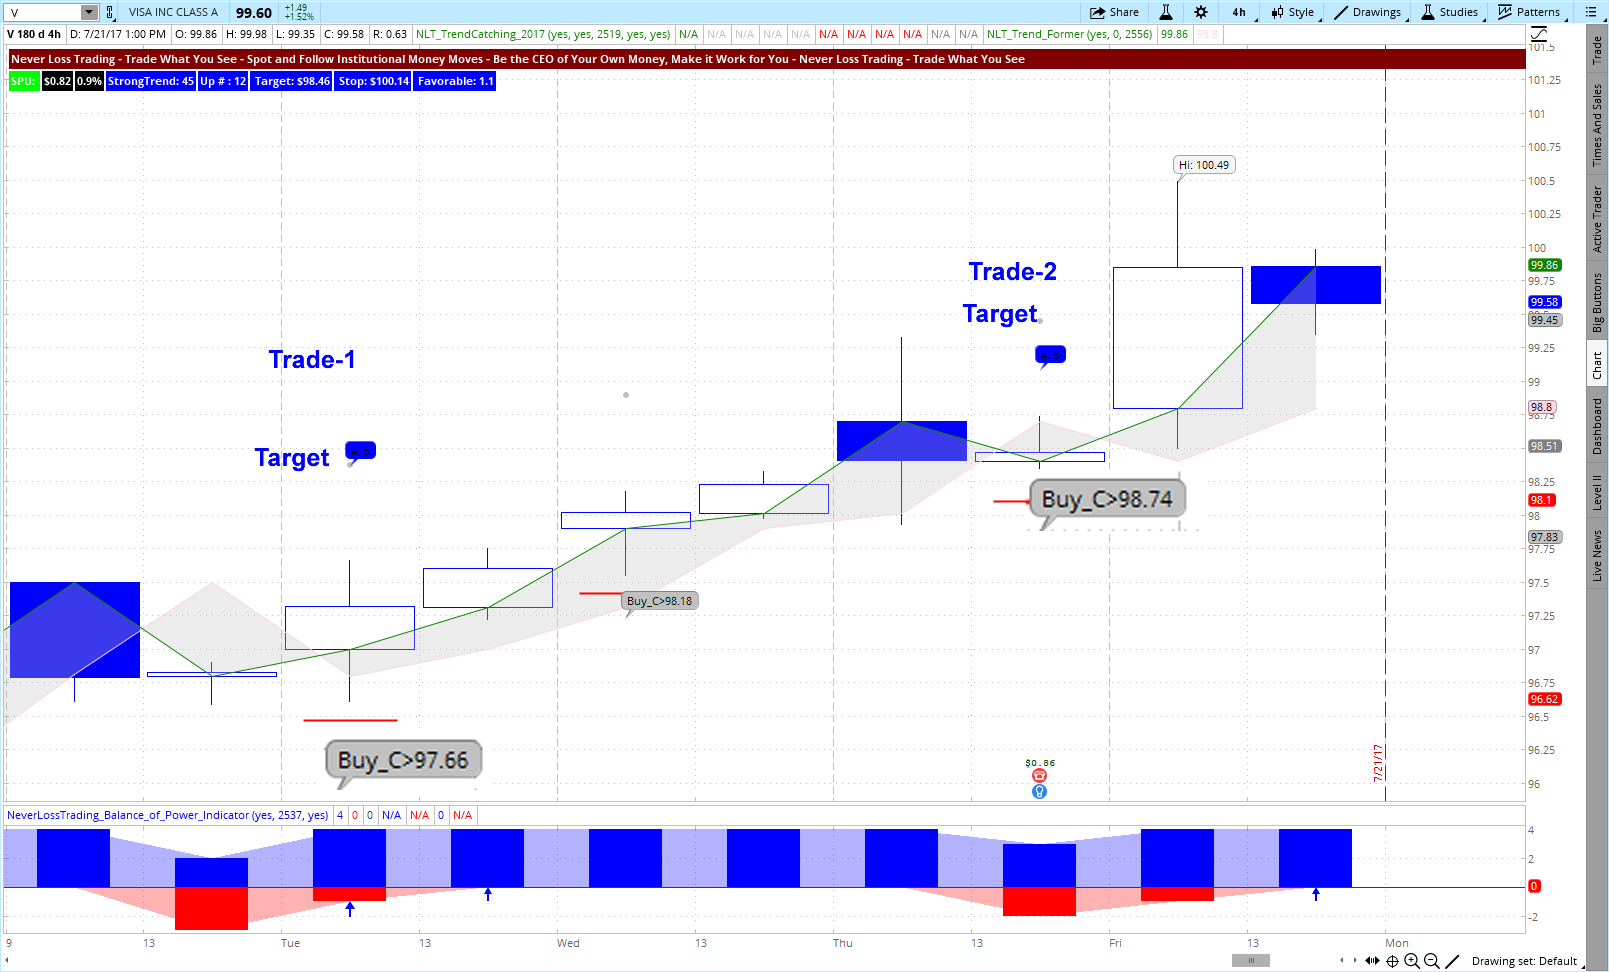
V: two signal and a 1.7% return on cash in two days
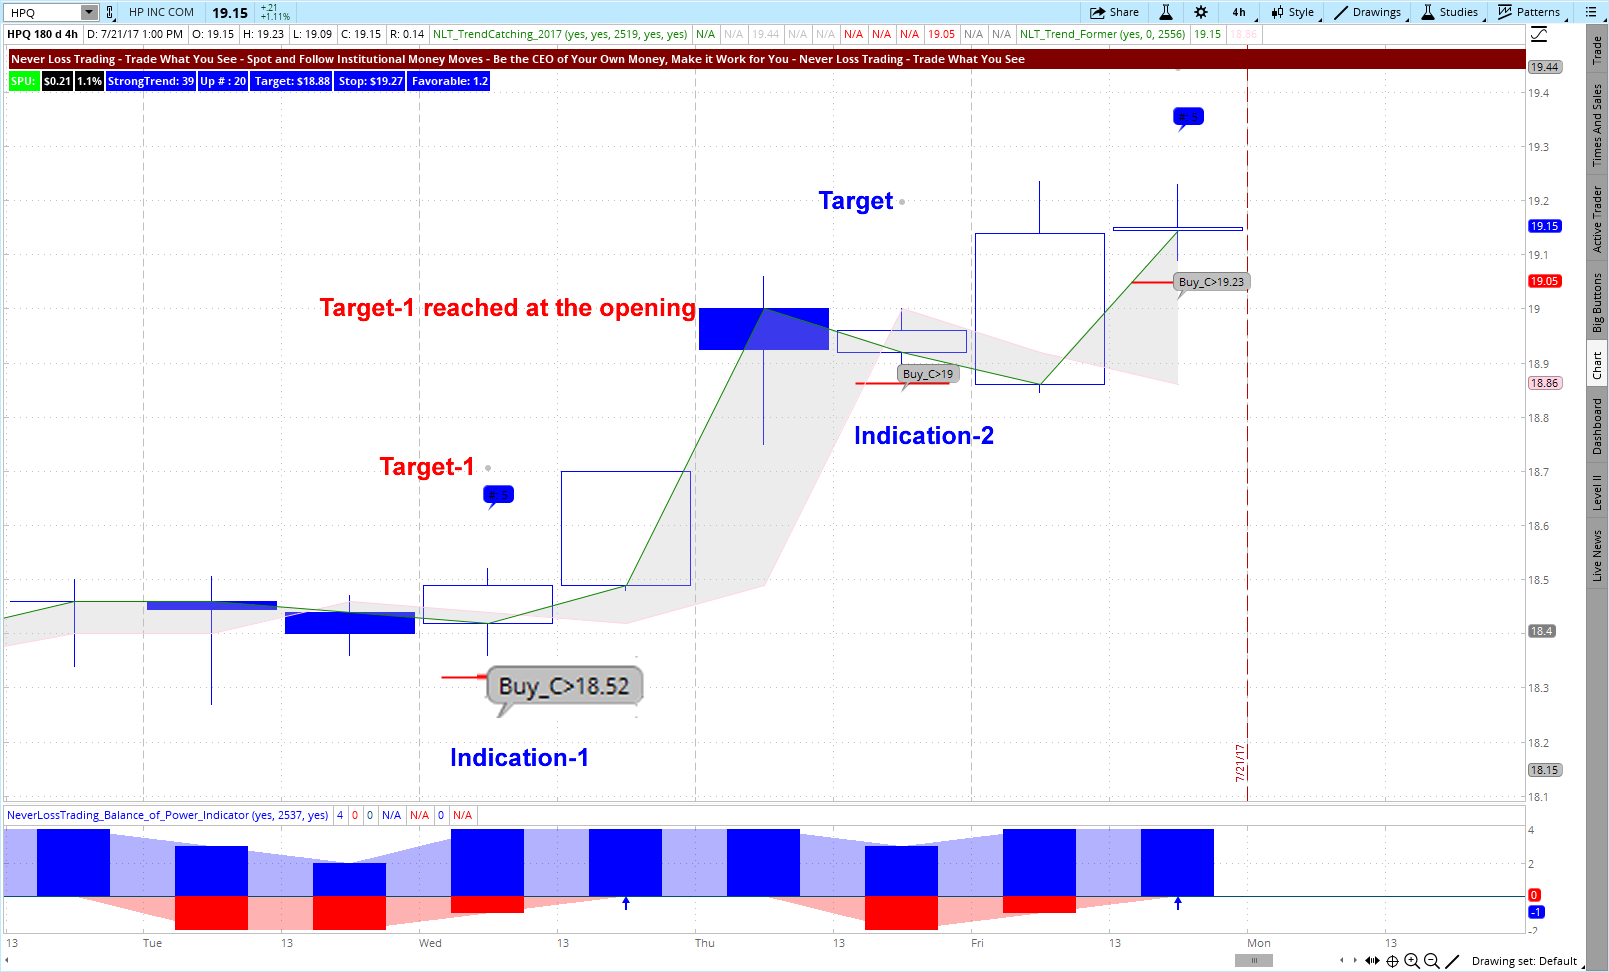
HP: two trade signals, each came to target in the next candle and a 3.3% return on cash
You will learn to operate trades with buy-stop and sell-stop OCO orders. This way, you can pre-program all trade entries and exits and thus, you have no need to be in front of your computer to control the trade: it controls itself after it triggers.
Let us give you an the chart demonstrations for NLT Trend Catching
Chart-1: FB 4-Hour Chart – one winning trade Chart-2:V 4-Hour Chart – two winning trades Chart-3:HPQ 4-Hour Chart – two winning trades
When you ask yourself where those signals came from? The NLT Long-Term Investor Alerts.
\ The NLT Long-Term Investor Alerts..click.
Besides stocks, we surely trade work with other assets. If you feel our trading style and systems can make a change to your trading, setup a consulting hour with us:
Learn how to find repetitive chart setups where you can trade with the odds in your favor – High Probability Trading. Experience why common trading systems and even betting for ≥2:1 price moves do not get you where you want to be and how to make a change to your trading.
We like to invite to join our free webinar on Thursday June 8, 2017 at 4:30 p.m.
By sharing proprietary content, there will not be a recording.
Description:
If you can estimate how a far a price
move will reach and why - and you put this in relation to where to place a key
action stop that considers the statistical volatility of the observed asset, identifying
a price level where it will be a pain for institutional investors to get the
price, then you can develop an edge for trading the financial markets by
trading with the odds in your favor.
Successful trading is based on finding and following repetitive supply- and demand patterns: The price change you see is a result, not a variable and hat we want to demonstrate, is how you can find and participate in directional price changes before they happen.
Prediction connects the subjective and the objective reality: This means, you can test what we show you in the real world: For you to compare how well you predict trade entries and exits today and how, what is shared with you, might make a change for your trading future.
By sharing proprietary content, there will not be a recording.
Description:
The vast majority: 85% of the financial markets are institutional money driven. Institutions always try to hide their footsteps; however, by the sheer size, they are identifiable and the private investor/trader can spot and trade along with them.
Successful trading is based on finding and following repetitive supply- and demand patterns: The price change you see is a result, not a variable and what we want to demonstrate, is how you can find and participate in directional price changes before they happen.
Prediction connects the subjective and the objective reality: This means, you can test what we show you in the real world: For you to compare how well you predict trade entries and exits today and how, what is shared with you, might make a change for your trading future.
There will not be a recording (proprietary details will be shared). In case you cannot participate, register and we will send you a written summary of the webinar content.
When markets are moving slower, there are still opportunities to capture:
The last hours of the day offer such opportunity and now, you can follow through on confirmed signals.
Knowing and testing this effect for the last years, we are ready to publish the last hour opportunity alert, which is integrated into our NLT All-in-One Alert.
In another filtering step we also developed the NLT Short list as a tab on the NLT All-in-One Alert.
This way you can easily carry over selected symbols into your watch list, to scan for high/low breaks:
Giving you the opportunity to be alarmed when one of the observed symbols fulfills the required chart setup conditions; without the need for you to watch and control multiple charts at the same time.
Ending the month of April, the NLT Long Term Investor Alert includes an updated monthly alert for May 2017.
Monday, May 1, most of Europe celebrates a holiday: Labor Day and thus, the pre-market on Monday might be a bit slower.
Today, we want to share with you seven key elements to consider for being a successful day trader, swing trader, long-term investor, or a combination of those.
Let us prepare a short list for you and then fill it with life:
Strategy: System
Faith: Follow Your System
Discipline: Focus
Preparation: Ready
Management: Execute
Improvement: Progress
Dedication: Plan
With the following guide, you have three choices:
Implement all of those steps on your own: took us more than 10,000 hours.
Find a provider who can teach you: we are in business since 2008.
Disregard them and continue the way you always did.
1) Law of Strategy: have a system with clear cut entries, exits, stop- or adjustment levels; that produces repetitive, favorable trade patterns for you.
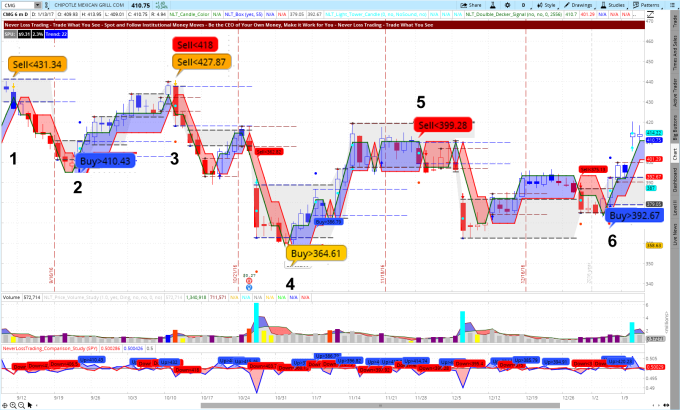
CMG Daily NeverLossTrading Top-Line Chart, September 2016 to January, 11, 2017
The CMG chart shows you multiple highlighted trade potentials, spelled out by the system, with the following conditions:
Trade, when the spelled-out price threshold is surpassed in the next candle to be sure other market participants follow the indicated direction.
On red- and blue signals, trade up to five bars or 2-Speed-Units (SPU); on orange signals trade for a maximum of 10-bars. In each case, you can trail your stop with the red line on the chart.
This way, you were able to participate in six trade setups. Let us discuss those one-by-one:
Situation
Signal
Trailed Stop
2-SPU Exit
Timing
1
Orange
+$24
+$19
Entry at 9/12/16
2
Blue
+$18
+22
Entry at 9/23/16
3
Red, Orange
+$14
+$20
Entry at 10/12/16
4
Orange
+$30
+$22
Entry at 11/3/16
5
Red
-$11
-$11
Entry at 11/29/16
6
Blue
+$21
+21
Entry at 1/6/2017
Result
+$96
+$93
The above table shows similar results by either trailing the stop or exiting after a 2-SPU move (SPU is an in-house developed algorithmic measure for the expected price move after institutional engagement was assumed and confirmed).
Without compounding interested and trading the stocks, a 25% return on cash in four month was achieved. We are specialists in teaching you how to trade options of the underlying, investing only 1% - 5% of the share value, accelerating returns, limiting risk. It will be eye opening for you!
2) Law of Faith: Follow your system, in particular at times when the going gets tough; no system produces 100% positive results and thus, dealing with setbacks and failure is part of trading.
It is easy to back test a system; just make sure it has clear cut rules for entry, exit, and stop. Check how many trades out of 100 confirmed trade situations were winners and how many losers.
We encourage people to use a system that produces high probability trade setups where you win more than 65% of the time…check for some recent examples…click.
Thus, when you have such system, hold the course, even when things go wrong. Unfortunately, this is where many give up and hunt for the next system; while considering that standard indicators will not give you a higher predictability than 55% on average.
3) Law of Discipline: When your time for trading is there, you focus, you are ready and prepared to execute on the opportunities that arrive, not letting other influences disturb you from doing what you prepared for.
Working or trading from home is not for everybody. Do not let daily life disturb your trading. Have your screen setups and everything in place that you can do what you want to do; focused and undisturbed.
The success principles of trading can be compared to professional sports: Success comes from skill and practice.
When stepping onto the plate, I am prepared to swing, wait for the right moment and trade.
On each opportunity, I am prepared to make short-term good profits, administering tight stops, and when the market allows, I am aiming for the fences.
Bring the odds on your favor; take trades in accordance to defined system entries.
Fill the bases: Scale in and out of positions to capitalize on home run possibilities.
Accept losses as part of trading, knowing the next trade will come from your system.
Concentrate on what you are doing without distraction.
4) Law of Preparation: Every day that you want to trade, you are prepared with a clear cut analysis, knowing which instruments to trade and how; you operate with a cheat sheet (electronic form welcome) of what to do and the strategy to follow.
NeverLossTrading offers multiple alerts to highlight trading opportunities for you. In two of our systems, you even operate with market scanners and watch list indicators, allowing you to do your own analysis on multiple time frames.
Let us give you one example for the newly developed NLT Strong Movers Alert. It is based on NLT Top-Line signals and highlights specifically strong price turning points.
For January 9, 2016 we had the following trade potentials specified and applying our conditions, this were the results.
Highlighted Stocks
Sentiment
Daily Chart Setup Approximation (tight stop)
Comment on the Daily Signal
Result
WMT
Bear
Favorable
Signal not confirmed
no trade
ADM
Bear
Favorable
Signal not confirmed
no trade
KBH
Bear
Favorable
Signal confirmed and trade closed 1/12/17
Win
PHM
Bear
Favorable
Stopped
Loss
TEVA
Bear
Acceptable
Signal confirmed and trade closed 1/11/17
Win
MDT
Bull
Favorable
Signal confirmed and trade closed 1/11/17
Win
EBAY
Bull
Risky
Risky, no trade.
no trade
A
Bull
Acceptable
Signal confirmed and trade closed 1/11/17
Win
TXN
Bull
Acceptable
Signal confirmed and trade closed 1/11/17
Win
The report contains per symbol, clear cut entry, exit, and stop rules to follow.
We offer multiple trading systems….click, all taught one-on-one, with high dedication to your best available times. If you like what you see, ask for a personal demonstration:
5) Law of Management: All trade mechanics are setup to execute your orders and in case you need to adjust a trade, you will know when and what to do. Trade adjustment has two dimensions: adding to winners and repairing potential losing trades. You work with buy-stop and sell-stop orders (bracket orders preferred), so you can pre-program your conditional orders in advance that they execute automatically when your conditions are met. This way you never run behind the happening and you realize the participation rate you desire.
6) Law of Improvement: You strive for constant improvement by journaling your trades to analyze what you do well, which you will repeat and where you did not do well; which you will stay away from if possible or improve.
We sure help you to do such and add a mentorship period after teaching you how to work with our systems, where you can send in your trades for constant feedback and improvement.
Hence, you are not alone, you are coached to turn yourself into the trader you want to be.
7) Law of Dedication: You treat trading as a business; regardless if you occasionally trade or trade for a living; thus, you follow a written business plan, which contains the elements of a financial plan: expected returns, maximum risk per trade etc. and an action plan: what to do when and how: instruments to trade, trade strategies to follow, times to be in or out of a trade (news announcement, earnings).
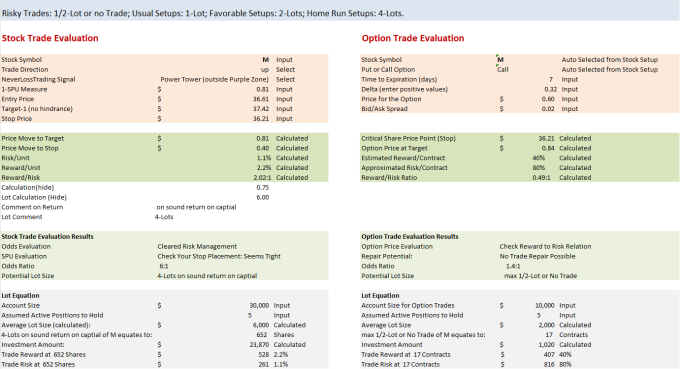
Example of a Position Sizing Model to Decide for Stock or Option Trades
The table above shows just one small instrument, our focus is having you to operate with a clearly distinct written business plan that gives you a sound perspective of the maximum risk you take per trade, the expected returns per instrument and trading strategies; how to put everything into action: a guide to follow striving for trading success as a day trader, swing trader, long-term investor or a combination of those.
We are ready to implement all of this into your trading routine: