
If trading was easy, nobody would ever go to work.
However, it can be learned when you are willing to follow clear cut success principles.
Read in the following how you can limit your risk and strive for steady results with an activity based trading system that helps you to spot and follow institutional money moves:
As a trader or investor, you are striving to achieve above market returns on your investments, else you could just hand over the responsibility and action to somebody else: Your broker e.g.
However, it looks like you decided to control your own financial destiny and we congratulate you for this decision:
If you don’t care about your own money, nobody else will.
With whatever instrument you choose to base your trading or investing decisions on, you are making an assumption for the potential outcome, while what you control the most, is the risk you are accepting per trade.
How to gauge the risk and thus achieve better results?
Assets have a natural volatility price development, which you better consider when trading directional. We help you as a trader to know where to act with your initial stop and how to potentially trail the stop on a price move: the red line on the chart signifies the stop level. It is on the bottom of the blue frame price development and on the top of a red framed price development.
NLT Income Generating Chart for /ES 10 Minutes on September 15, 2016
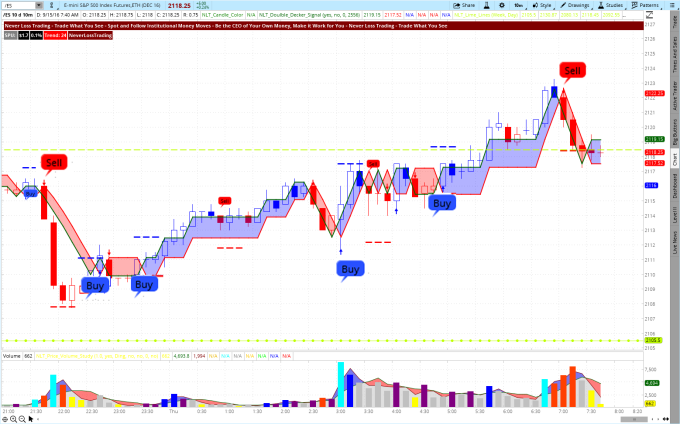
Directional entry points are highlighted through a Buy or Sell signal. By following our system, you only trade when the high of a buy signal or low of a sell signal is surpassed in the price development of the next candle. This way, you assure that other traders or investors follow through on the new price direction found.
The target for the trade is highlighted by a red line and thus allows you to predefine your exit; however, you can also trail your exit with the red line of the blue- or red frames of the price move.
If you followed the system in the chart above, you produced five winning trades in the observed overnight session for the E-Mini S&P 500 futures.
Trade What You See: Let the chart tell, when to buy or sell.
NLT Daily Wealth Building Chart for GLD, August 15 to September 16, 2016
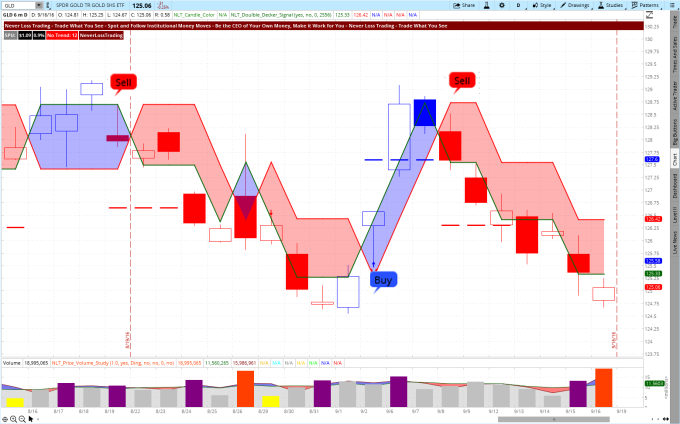
The chart for GLD (Gold ETF) shows you three solid entries that came to target. At the buy signal, the price quickly jumped up and you will learn in our mentorship how to best act on such situation.
Imagine you learned how to trade those signals with stock options, limiting your risk in the trade and leveraging your potential outcome. In the highlighted trade situations, you were striving for an average of a 75% return on investment, investing less than 1% of the share price for trading options.
You learn all this in our mentorships:
Ask us for our election special for NLT Wealth Building and Income Generating,
By teaching one-on-one, capacities are limited, so do not miss out.
If you feel this is for you, ask for a live demonstration:
Call +1 866 455 4520 or contact@NeverLossTrading.com
In case you are not yet signed up for our FREE Trading Tips, Reports, and Webinars... click.
We are looking forward to hearing back from you.

No comments:
Post a Comment