
“It's tough to make predictions, especially about the future.”
This quote, given by the famous baseball player Yogi Berra already summarizes the problem trader’s constantly face: Finding repetitive situations, where the future price move of an asset can be predicted with high probability.
Trading systems shall provide you with a structured approach to tell which situation to consider and which not: where to place your entry, exit, and stop or adjustment level.
But what is high probability compared to the opposite: low probability?
Our definition is easy: A system that gives you trade setups, verified by past performance, where you have a >63% probability to predict the future price happening is high predictability and everything else is low probability.
Let us give you some examples:
NeverLossTrading Top-Line Chart for Crude Oil: September 26 – December 2, 2016
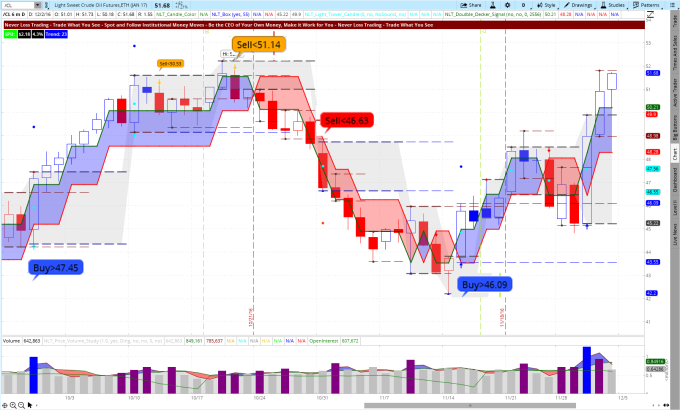
The NeverLossTrading Top-Line chart shows you five potential trade situations that all have an easy condition to specify your trade entry:
The spelled out price threshold: Buy>$47.45, Sell<$46.63 has to be surpassed in the next candle. Only when this is given, you accept the trade; allowing you as a trader to work with buy-stop or sell stop orders. This way, you do not even have to be in front of your screen: you can preprogram your trades to this condition and have them auto-filled.
When you check the above chart, following this principle mechanically, lead to four winning trades (magnified) and one losing trade (first orange signal from the left): winning four out of five, gave our system in the observed time frame an 80% predictability and thus, high probability!
When you consider the following simple exit rules: At red and blue signals, consider that a price move that starts in a NLT Light Tower (candles with a cyan color dot), likes to end in a NLT Light Tower. In addition: you are in average, five bars in a directional trade on those signals. Putting this together, is giving you an easy game plan to follow. On orange signals, we even like to trade for 10-bars.
But what to do if your risk tolerance does not allow you to trade daily crude oil charts?
We teach you how to trade derivatives, scaling your risk levels in $50 or $100 increments.
Does that also work on lower time frames?
Absolutely, we us fractal based mathematical models, focused on spotting and following institutional money moves and this way giving you repetitive happenings: let us put a proof to it!
NLT 1-Hour Top-Line Chart for Crude Oil, November 29 to December 2, 2016
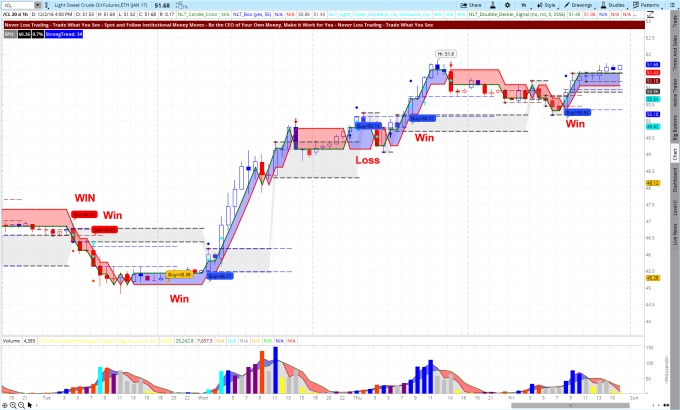
The chart shows you six trade situations that were validated by the next candle ticking out the set price threshold, leading to five winners and one loser: 83% probability for success in the observed time frame.
We teach our systems one-on-one, focusing on your specific wants and needs: NLT Top-Line is our top of the line; however we also offer entry level systems and allow traders to upgrade later, discounting the tuition payment from the price of the upgrade.
Take a look at our offering…click and let us know which system you want us to give you a personal demonstration on.
Call +1 866 455 4520 or contact@NeverLossTrading.com
By teaching one-on-one, spots are extremely limited, so do not miss out!
We are looking forward to hearing back from you,
Thomas

No comments:
Post a Comment