
Based on history, the number twelve has a high importance in human life; however, in the last two centuries we started to focus on the decimal systems and consider that everything works 24/7.
Watch the video…click or read on:
When you cut your trading day into two hour increments, you divide the day into 12 trading opportunities for six days of trading.
Why six trading days?
The futures and FOREX markets open Sunday and close Friday.
Let us show you a couple of examples how this looks on a chart and later explain why the 2-hour time frame is powerful for you (has to do with signal to noise).
NASDAQ E-Mini Futures on a 2-Hour NLT Trend Catching Chart
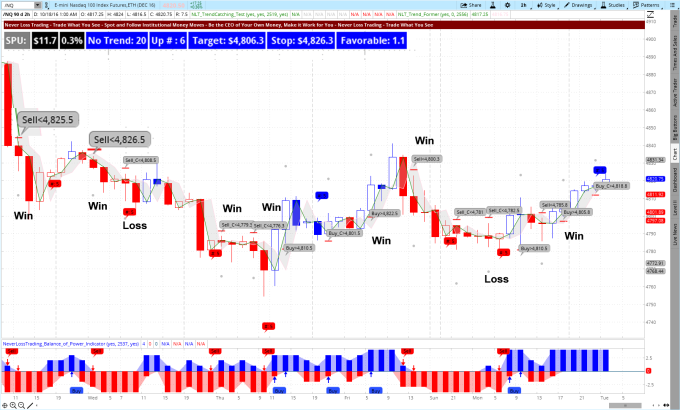
The above chart shows 10-trading opportunities in four days, seven winners (70%) and three losses (30%) by just following the signal mechanically: Certainly high probability trading; however, we also teach in our mentorship how to appraise trades situations individually, risking more when the odds are in you favor and allow ourselves to not trade if this is not the case.
In the left upper corner of the chart you see SPU: our measure that defines bar by bar how far a price move most likely reaches after institutional engagement is found. The expected price move distance is marked by a gray dot on the chart.
Further you are getting an indication if you are in a trending environment: blue for up, red for down. To help you entering your bracket order, a target and stop point are expressed bar by bar, with an appraisal of the reward to risk ratio:
Our NeverLossTrading dashboard to simplify your actions.
The bottom study: NLT Balance of Power shows you if Buyers dominate (blue) or Sellers (red), spelling out additional trading opportunities with buy and sell bubbles, that are either confirming the upper chart signals or producing own directional price indications.
Instead of trying to catch the entire price move from the beginning to the end, the NLT Trend Catching system supports you by dissecting trends into price increments, so you can trade multiple times in a directional price move.
How does this work with stocks?
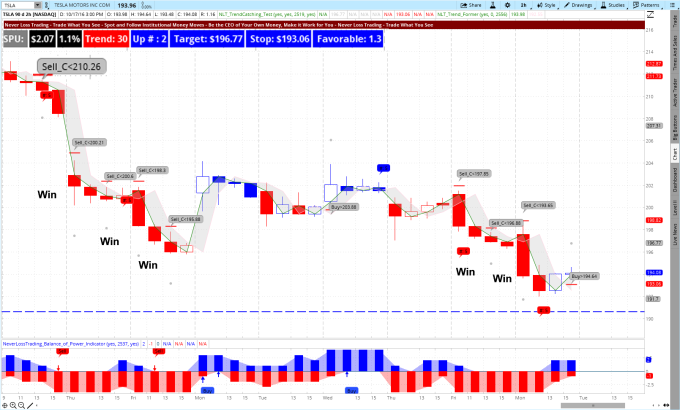
TSLA on a 2-Hour NLT Trend Catching Chart: October 5 – 17
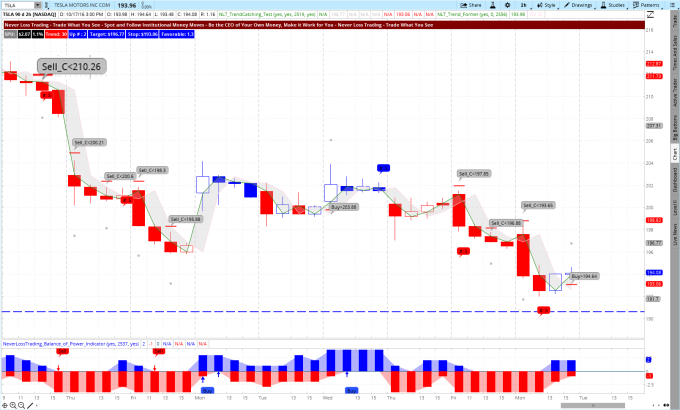
On October 5th, late in the day, we receive a short signal and we are catching a very nice move to the downside, producing a $8 price move. Then we further participate on the second wave of the price breakdown with a signal on October 7th, 2016. In the days of October 10 – 13, we receive no signal confirmation and no trade, to then be active again on October 14th and 17th, to harvest on the breakdown. In total, we are producing five winners out of five potential trades in total a price move of about $18 in nine days:
A 9% return on cash, an 18% return on margin and humongous return on Option trading capital if you follow our specifically developed option trading program.
TSLA on a 2-Hour NLT Trend Catching Chart: October 5 – 17
If you like to be part of this, ask for our Election Special on NLT Trend Catching.
Call +1 866 455 4520 or contact@NeverLossTrading.com
If you are not yet part of our free trading tips, reports, and webinar…sign up here.
By teaching one-on-one, focusing on your specific wants and needs, spots are limited, so do not miss out.
Good trading,
Thomas

No comments:
Post a Comment